April 27, 2023
Unlocking Logstail’s Key Reporting Capabilities
What is the Logstail Reports Feature
Logstail Platform is a powerful log management and infrastructure monitoring platform that allow you to collect, store, analyze and visualize large amounts of data in real-time. Logstail Platform has a variety of features and capabilities, one of such is the Reports Feature.
The Reports Feature is a powerful tool that allows you to generate customized reports and visualizations based on the data in your indexes. With this feature, you can create a wide range of reports, including charts, graphs, tables that provide valuable insights into your data and even export your ingested data. Whether you’re looking to track key metrics, identify trends, gain a deeper understanding of your data or get a scheduled report, the Logstail Reports Feature can help.
In this blog, we’ll explore the key feature and benefits of the Logstail Reports Feature, and show you how to get started with creating your own reports. Whether you are an experienced user or just getting started the Reports Feature is a powerful tool that can help you get the most out of your data.
Why you should use the Reports Feature
Reports are important because they provide valuable insights into your data that can help you make informed decisions. By generating reports, you can get a clear understanding of trends, patterns, and anomalies in your data, and use this information to optimize your business processes, identify opportunities for growth, and mitigate risks.
Reports can also help you track key metrics and performance indicators. By monitoring these metrics overtime, you can identify areas where you need to improve and make data-driven decisions to achieve your goals.
In addition, reports can help you communicate your findings to stakeholders and decision-makers withing your organization. By presenting your data in easy-to-understand format, you can help others understand the key takeaways from your analysis and gain buy-in for your recommendations.
Key features of Reports Feature
The Logstail Reports Feature comes with a variety of features that make it a valuable tool for any organization or individual user looking to gain deeper insights into their data. One of the key features is the ability to generate customized reports and visualizations based on your ingested data. That means that you can easily create reports that are tailored to your specific needs, whether you are tracking system activity logs, monitoring website traffic, or analyzing potential attacks and vulnerabilities.
In addition you can use the Reports Feature to generate reports containing a variety of visualizations ( such as line charts, bar charts, and pie charts), generate report containing a whole dashboard with visualizations or export your ingested and analyzed data. This allows you to present your data in a way that is easy to understand, is visually appealing and you have the ability to keep and share local backups of your data.
Reports Feature also provides the ability to set up automated reports, so you can receive regular updates on your data without having to manually generate reports each time and never miss an event that might threat your environment.
How to use the Reports Feature
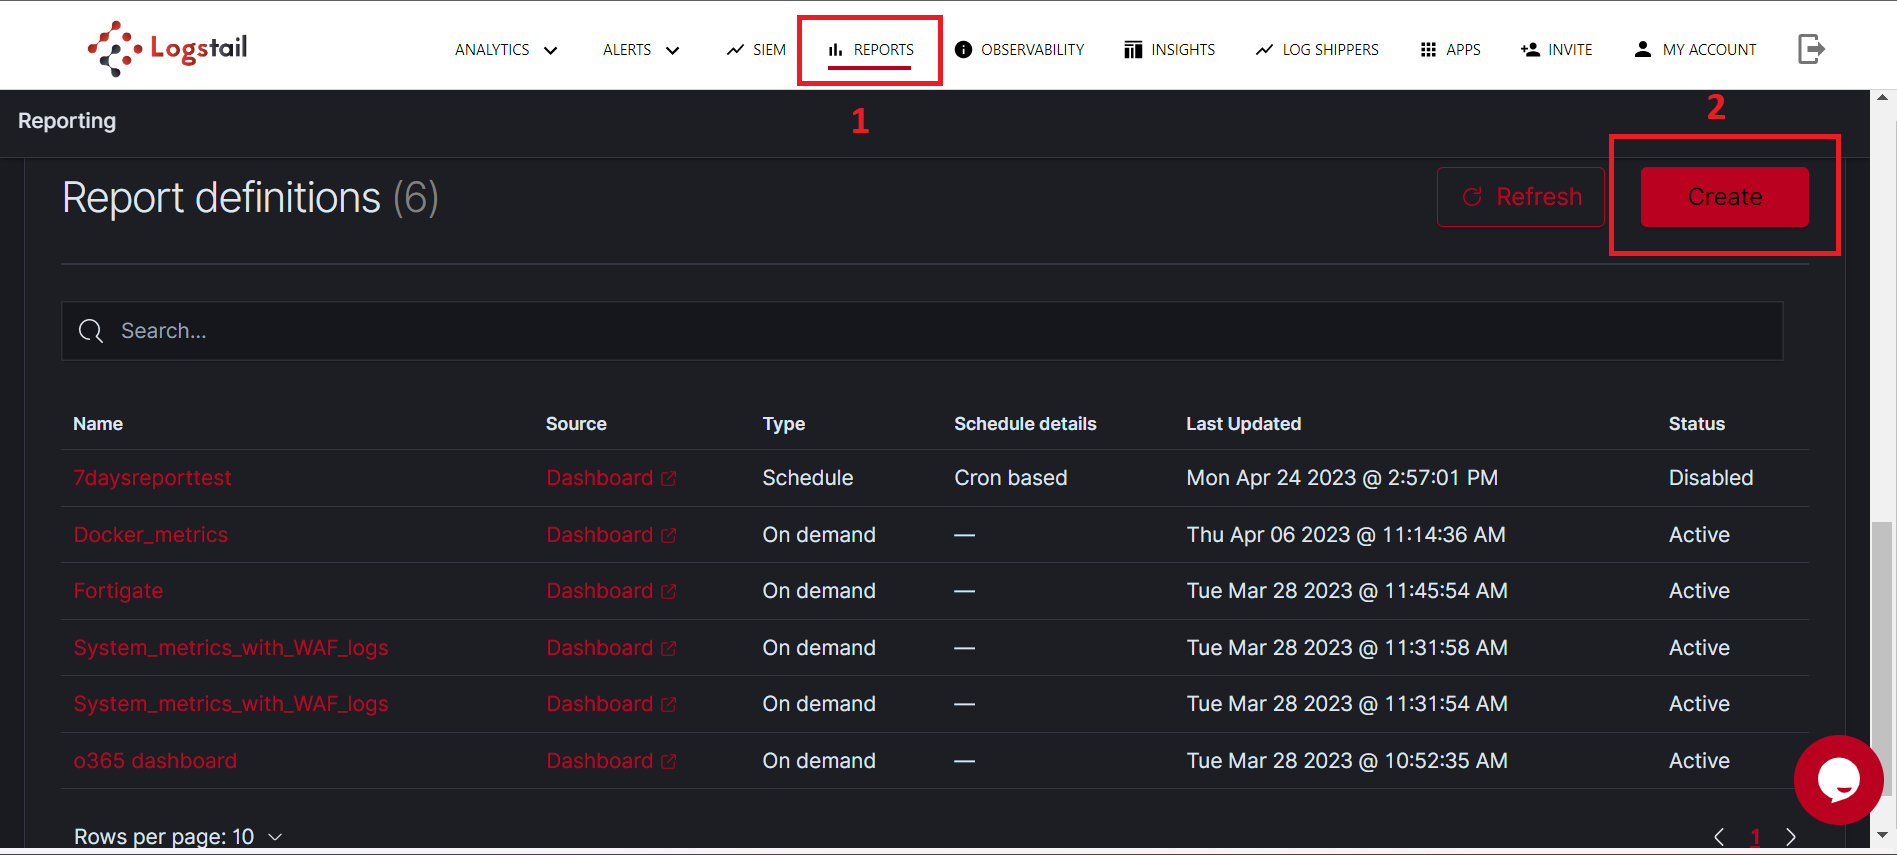
- Navigate to Logstail Reports Feature.
If you don’t have a Logstail Account you can create one here. - Create a new Report definition.
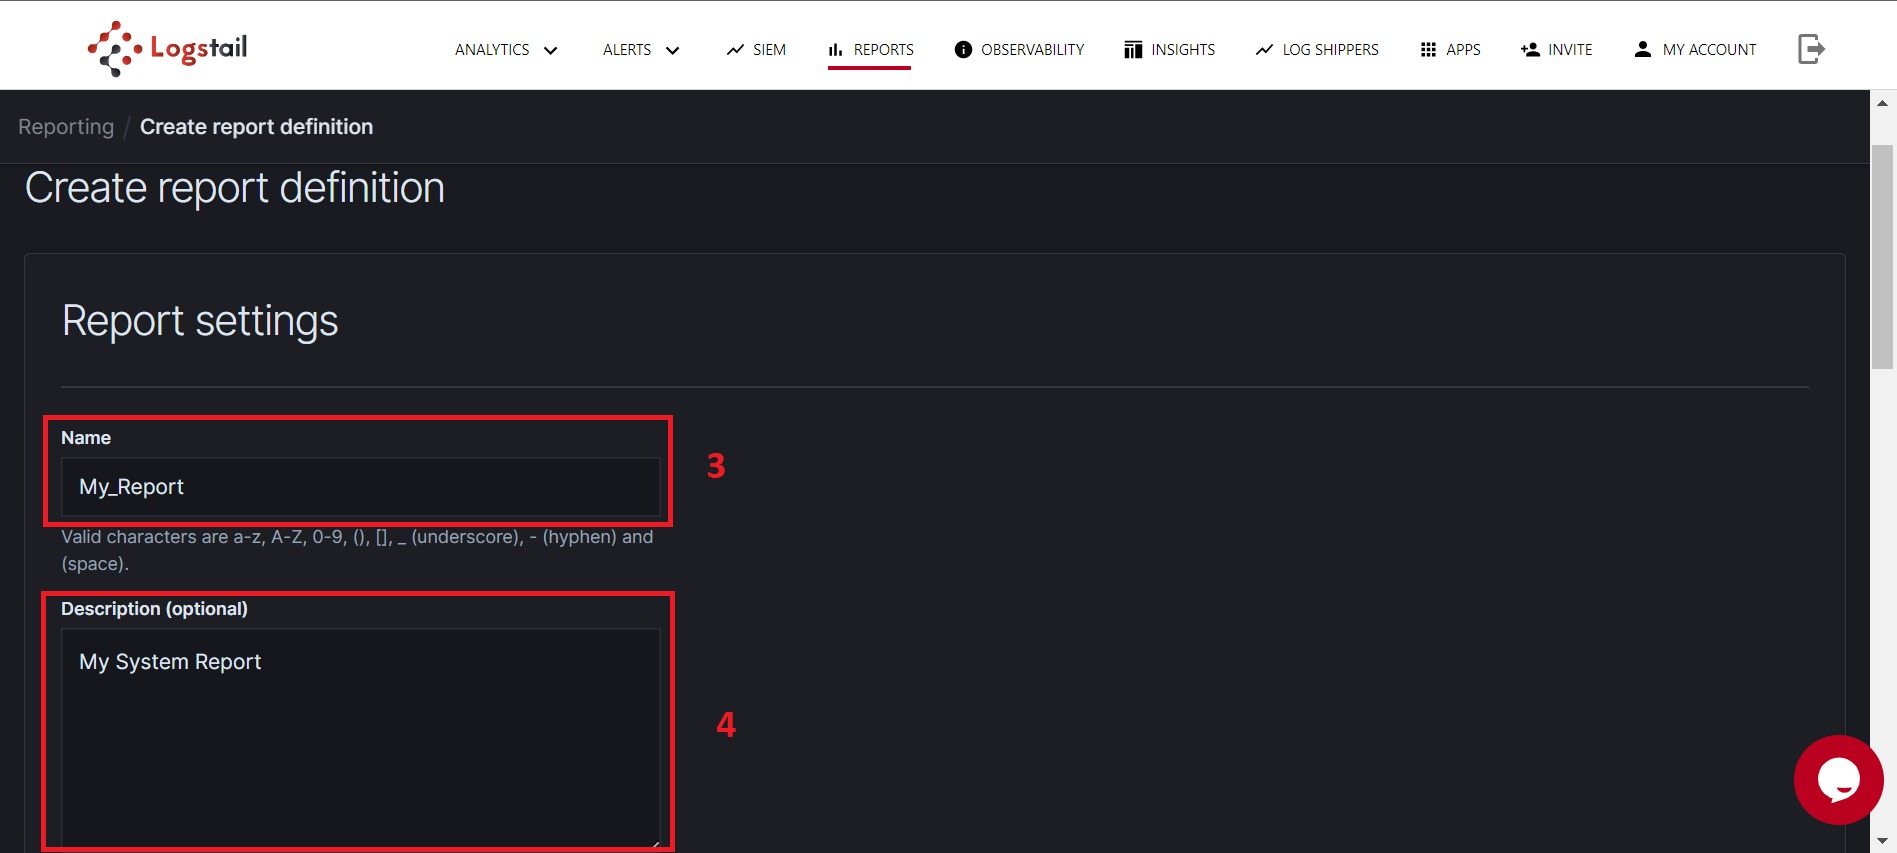
- Enter a Name for your Report.
- Optionally enter a Description.
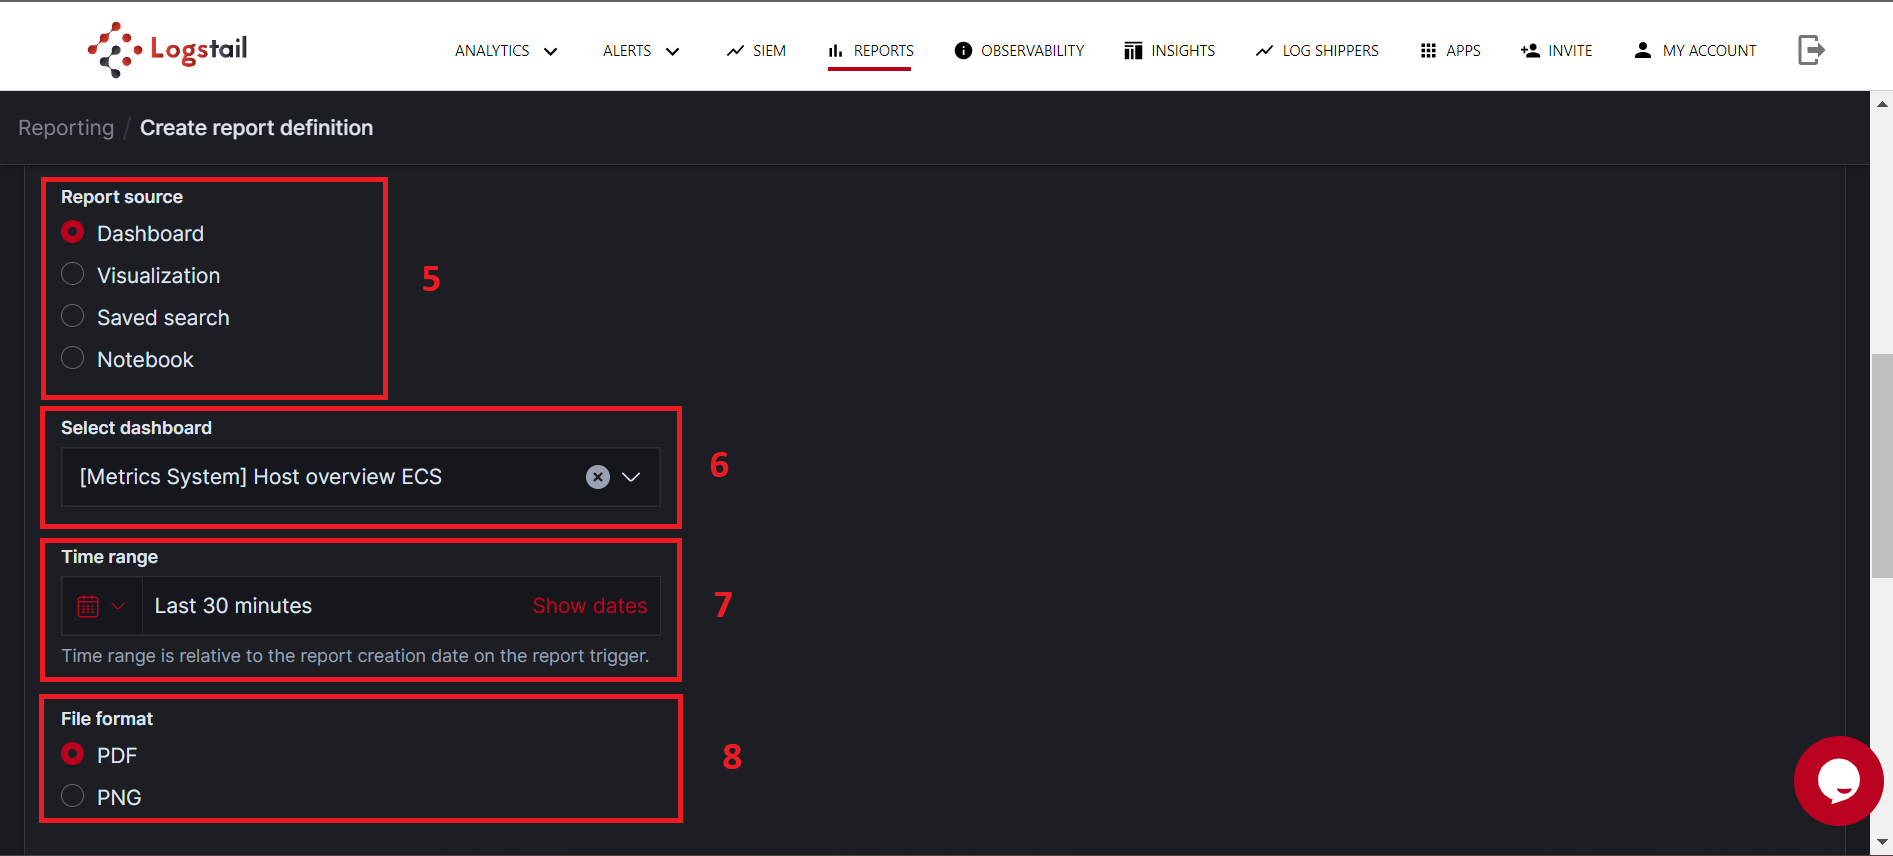
- Select the type of source you want to add to your Report. You can choose between dashboards, visualizations, saved searches and notebooks. (Observability feature is required for notebooks)
- After selecting the type of source, select the desired source from the list with the available ones. (Only installed dashboards and visualizations are displayed in the list)
- Select the Time Range of data for your Report. (e.g. Last 30 minutes will include data ingested in the last 30 minutes from Now)
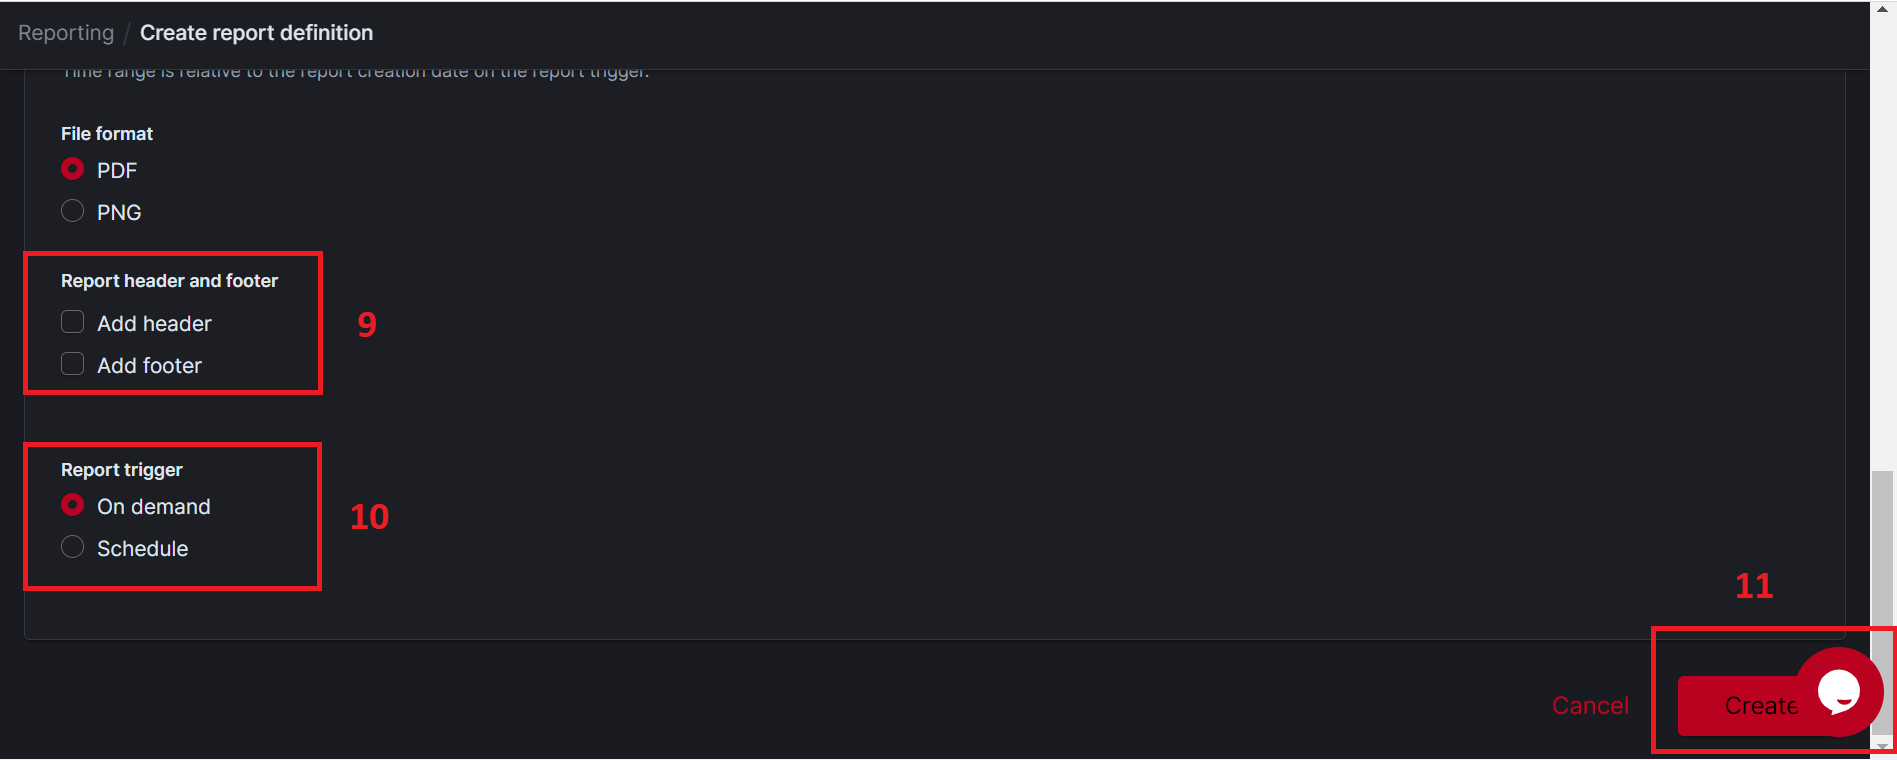
- Select the file format between PDF and PNG. (Reports containing Saved Search are in CSV format)
- Optionally, you can add your own header and footer to the Report. (Default header is Logstail Report)
- You can either create an On-demand Report or create a Scheduled Report based on a request time.
- Click create to create your Report.
Setup Scheduled Report
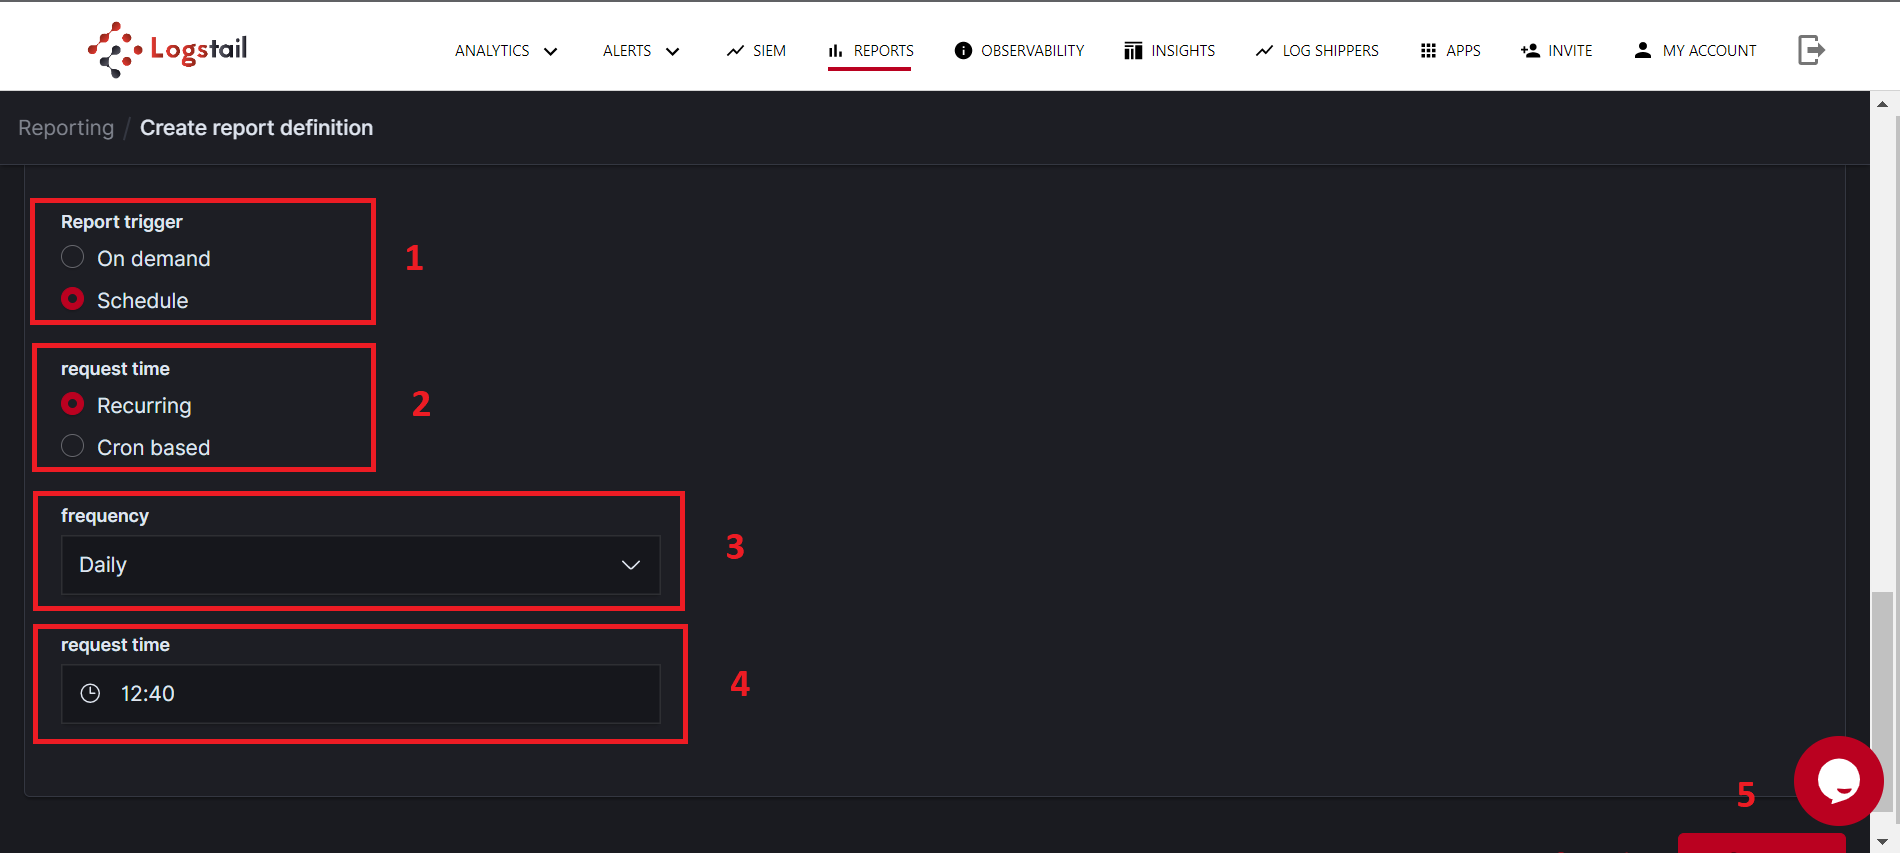
Daily Recurring
- Select Schedule as a Report Trigger.
- Select Recurring as a request time.
- Select Daily as frequency.
- Enter the desired request time.
- Click create to create your Report.
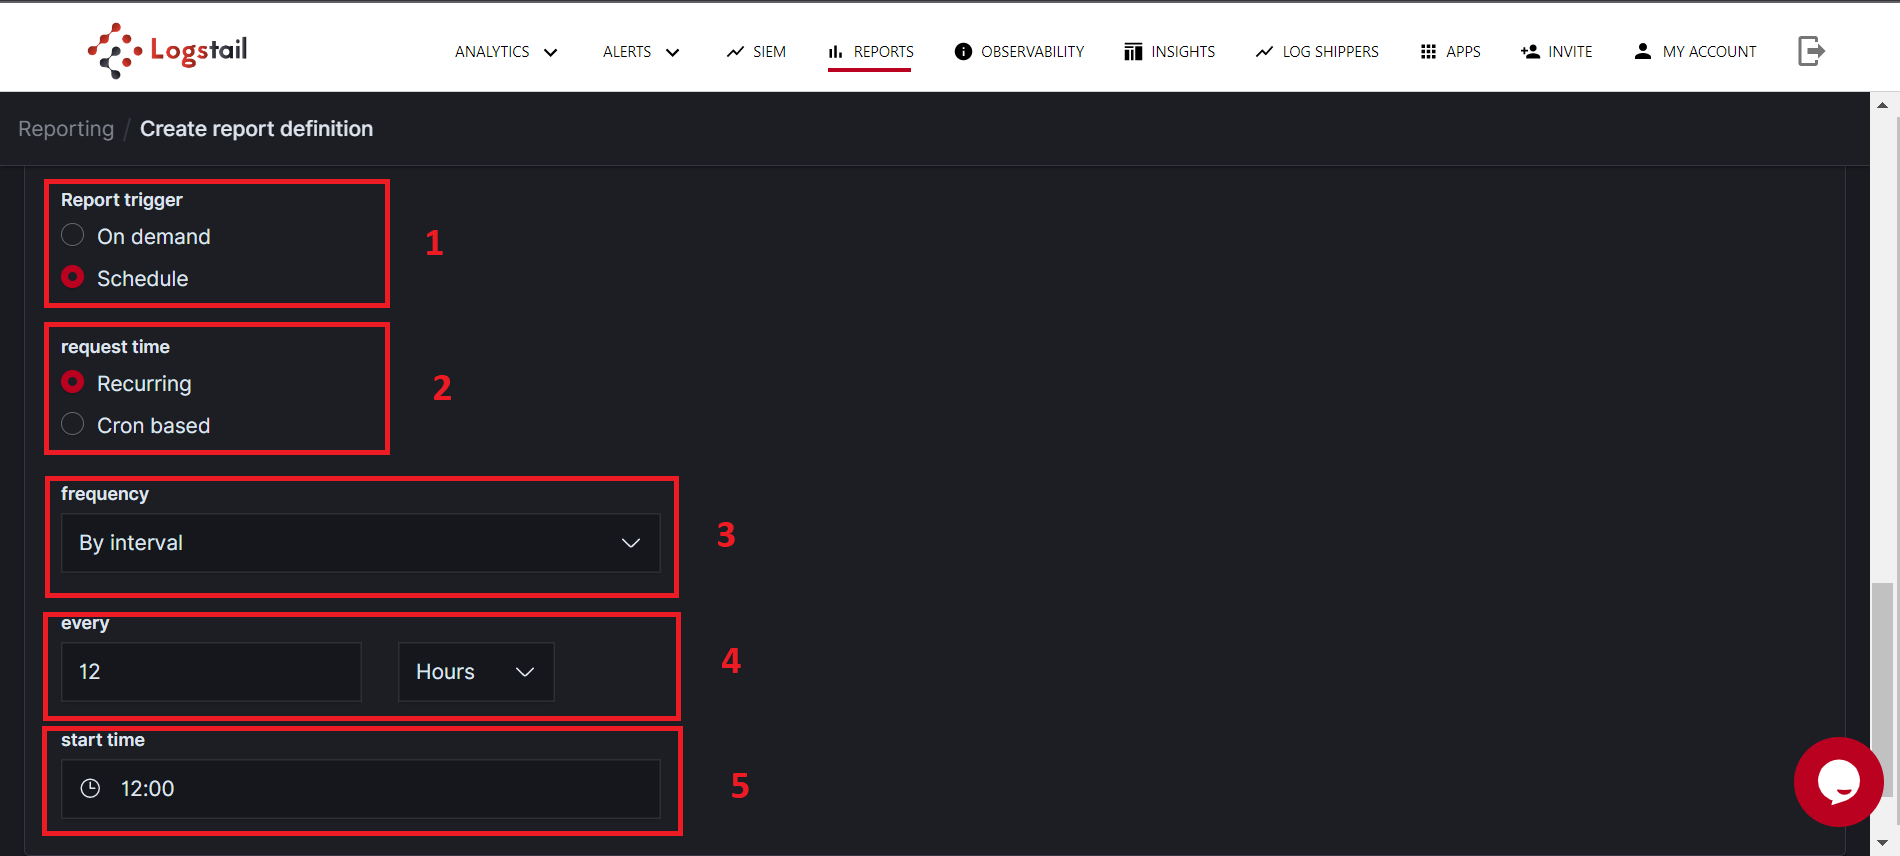
Recurring By Interval
- Select Schedule as a Report Trigger.
- Select Recurring as a request time.
- Select By Interval as frequency.
- Enter when you want your Report to get generated.
- Enter the start time.
- Click create to create your Report.
Chron based
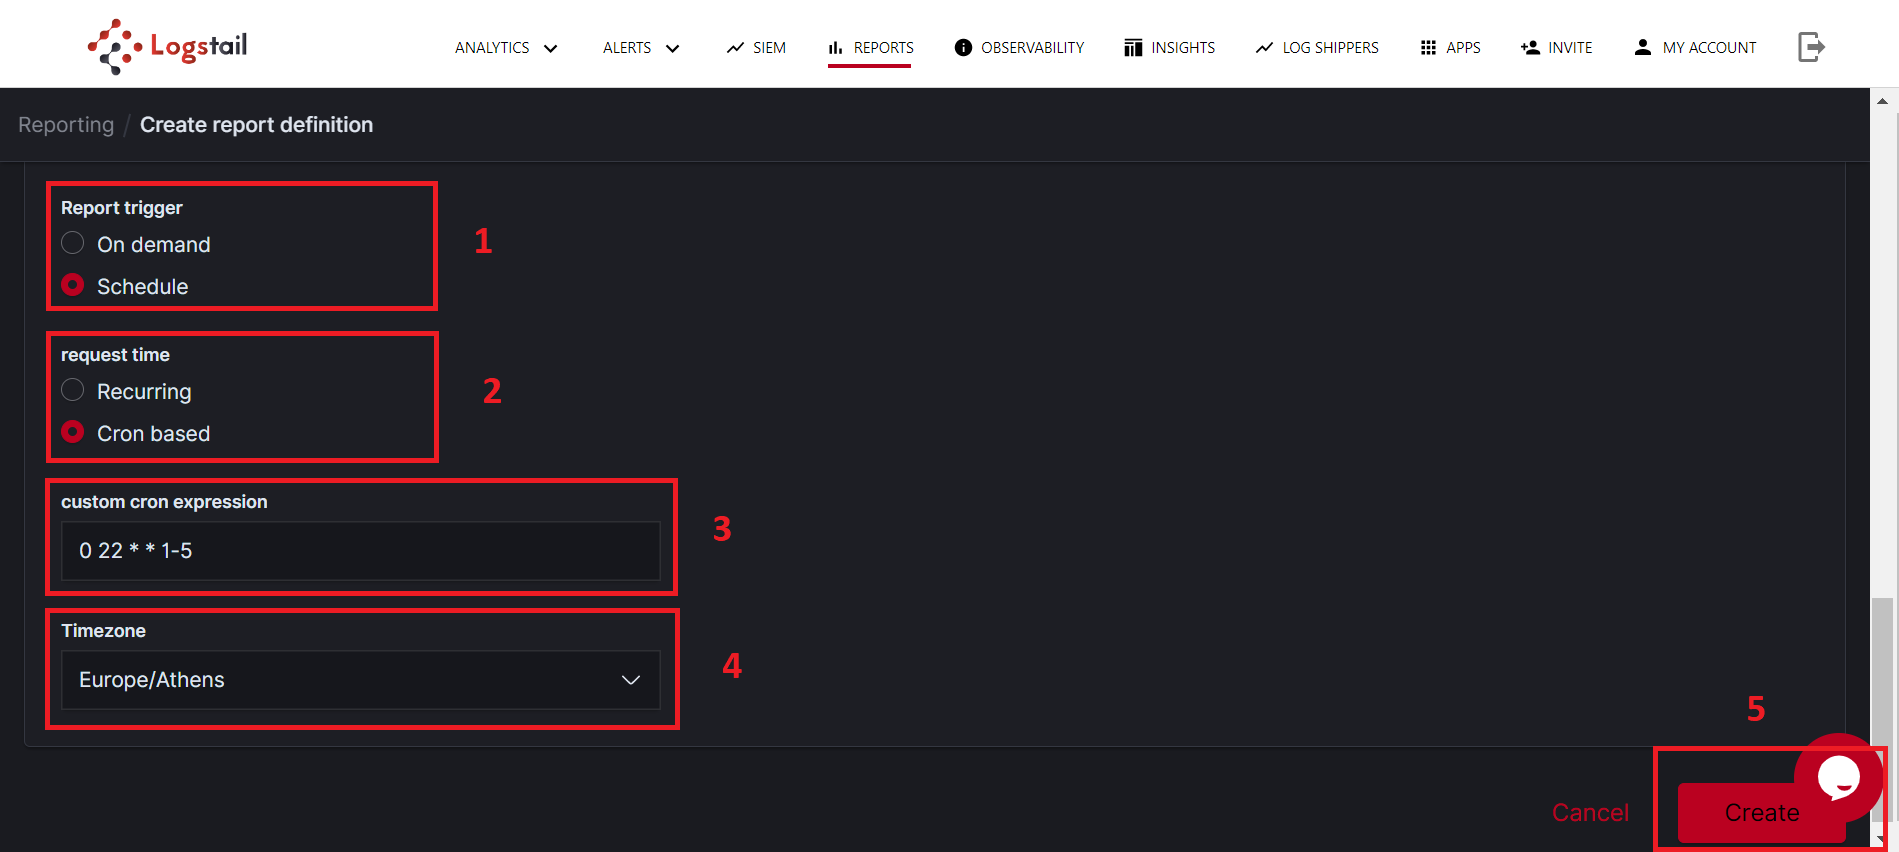
Cronjobs are automated tasks that run on a pre-defined schedule. A cronjob can be used to schedule a wide range of tasks, including Report generation. The scheduling can be as simple or as complex needed, with the ability to specify minute, hour, day, month and weekday parameters. The syntax for defining a job can be somewhat complicated, but there are plenty of resources available online that can help you. (e.g. Crontab guru)
- Select Schedule as a Report Trigger.
- Select Cron based as a request time.
- Enter your custom cron expression.
- Select your Time zone.
- Click create to create your Report.
Create Saved Search Report (Export your data)
Saved Search Reports can be useful if you want to export a desired search on your data or if you want to take backup of your ingested and analyzed data. The Saved Search Reports are in CSV format making them lightweight, keeping the format of the analyzed fields. This makes them essential for keeping backups of your data, running further analysis or even creating your own datasets.
Create a Saved Search of all data
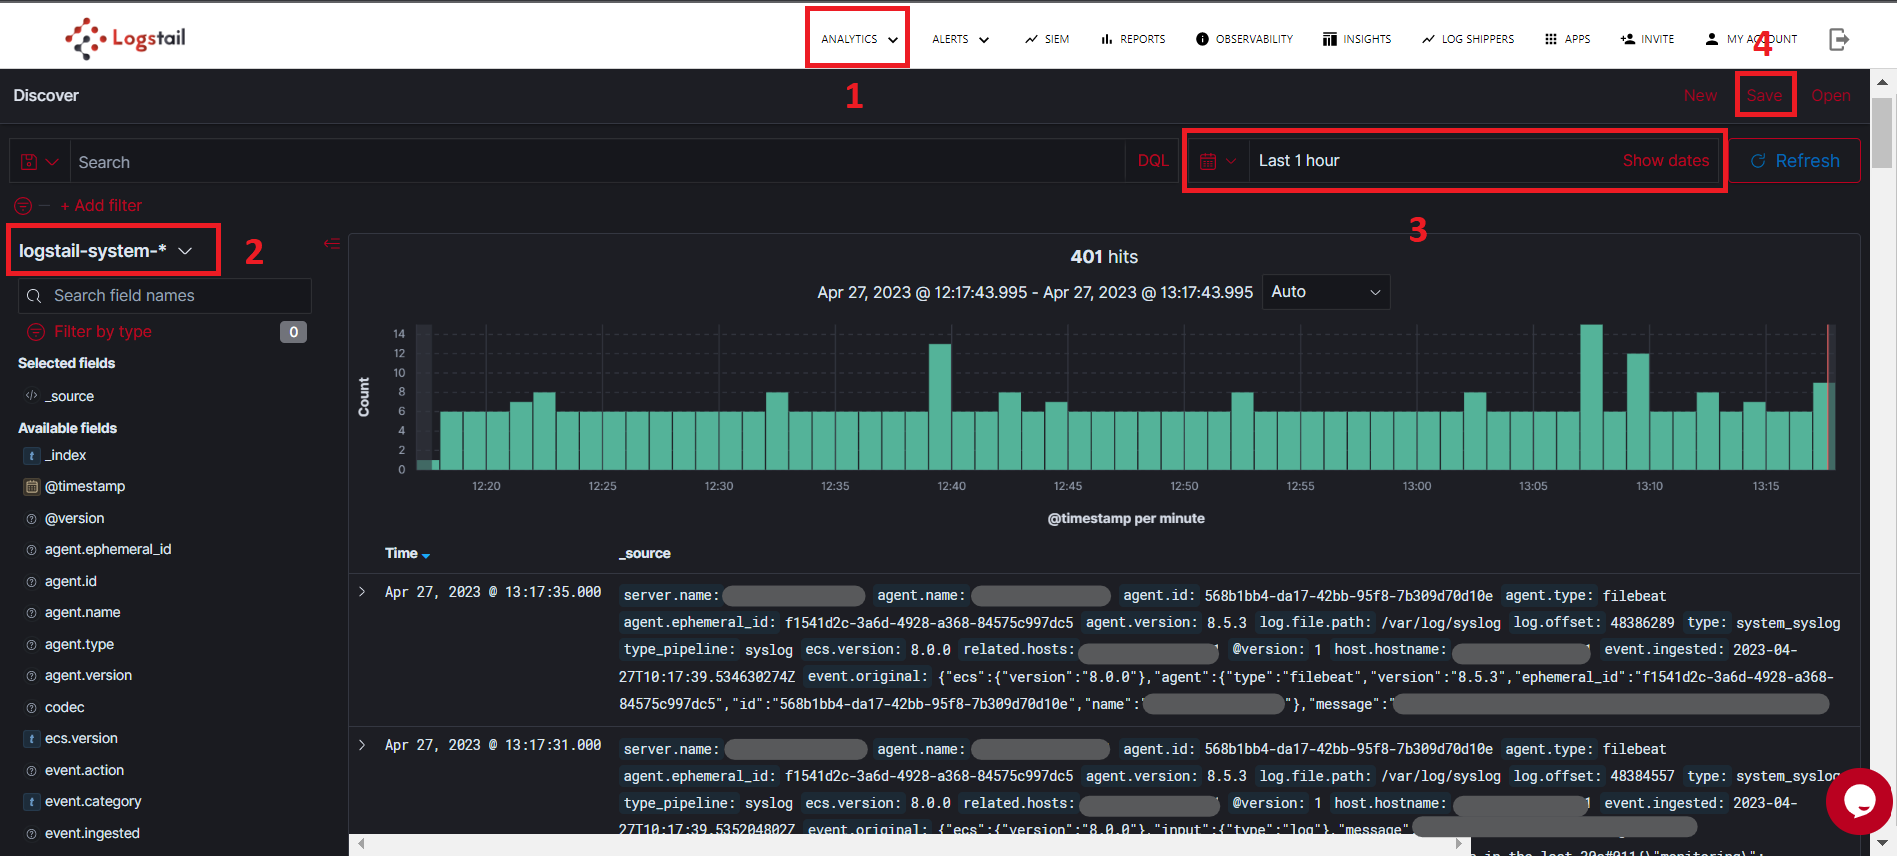
- Navigate to Logstail Discover feature.
- Select an Index.
- Select your desired time range.
- Save your search.
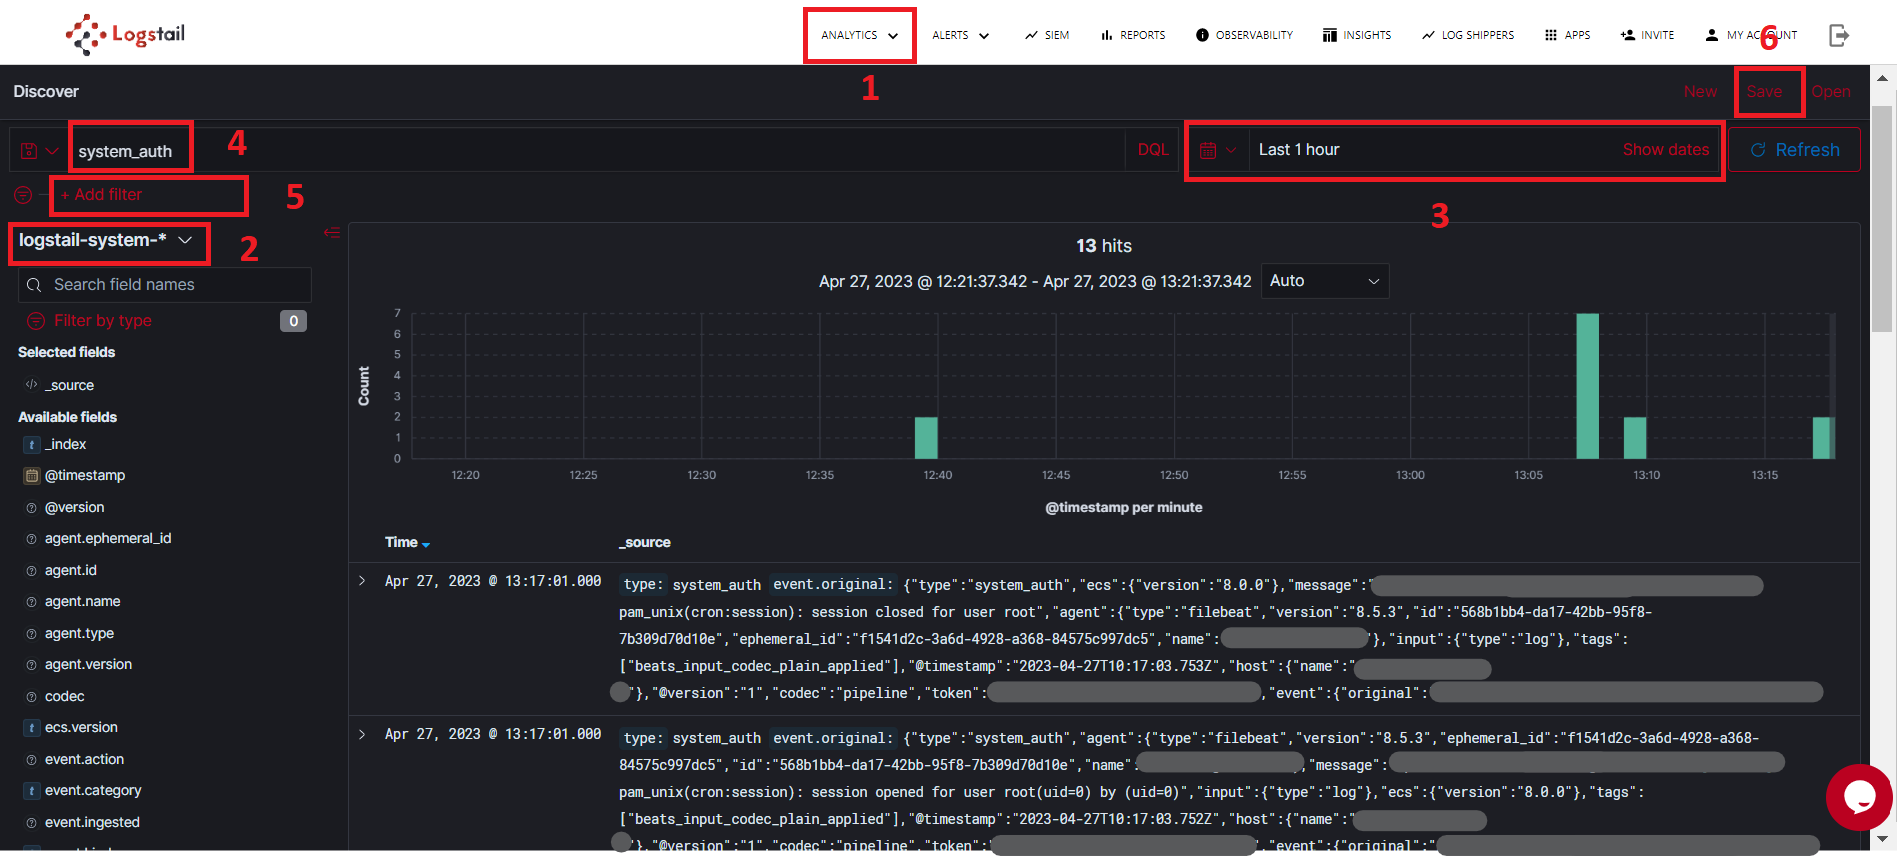
Create a Saved Search based on filter
- Navigate to Logstail Discover feature.
- Select an Index.
- Select your desired time range.
- Search for specific text in your data.
- Alternatively, you can add a filter.
- Save your search.
After saving your search, you can go back to Reports Feature, create a new report, select Saved Search as report source and select your Saved Search.
After creating your Report, you can view it in the Reports list where you can download it using the Generate Button. 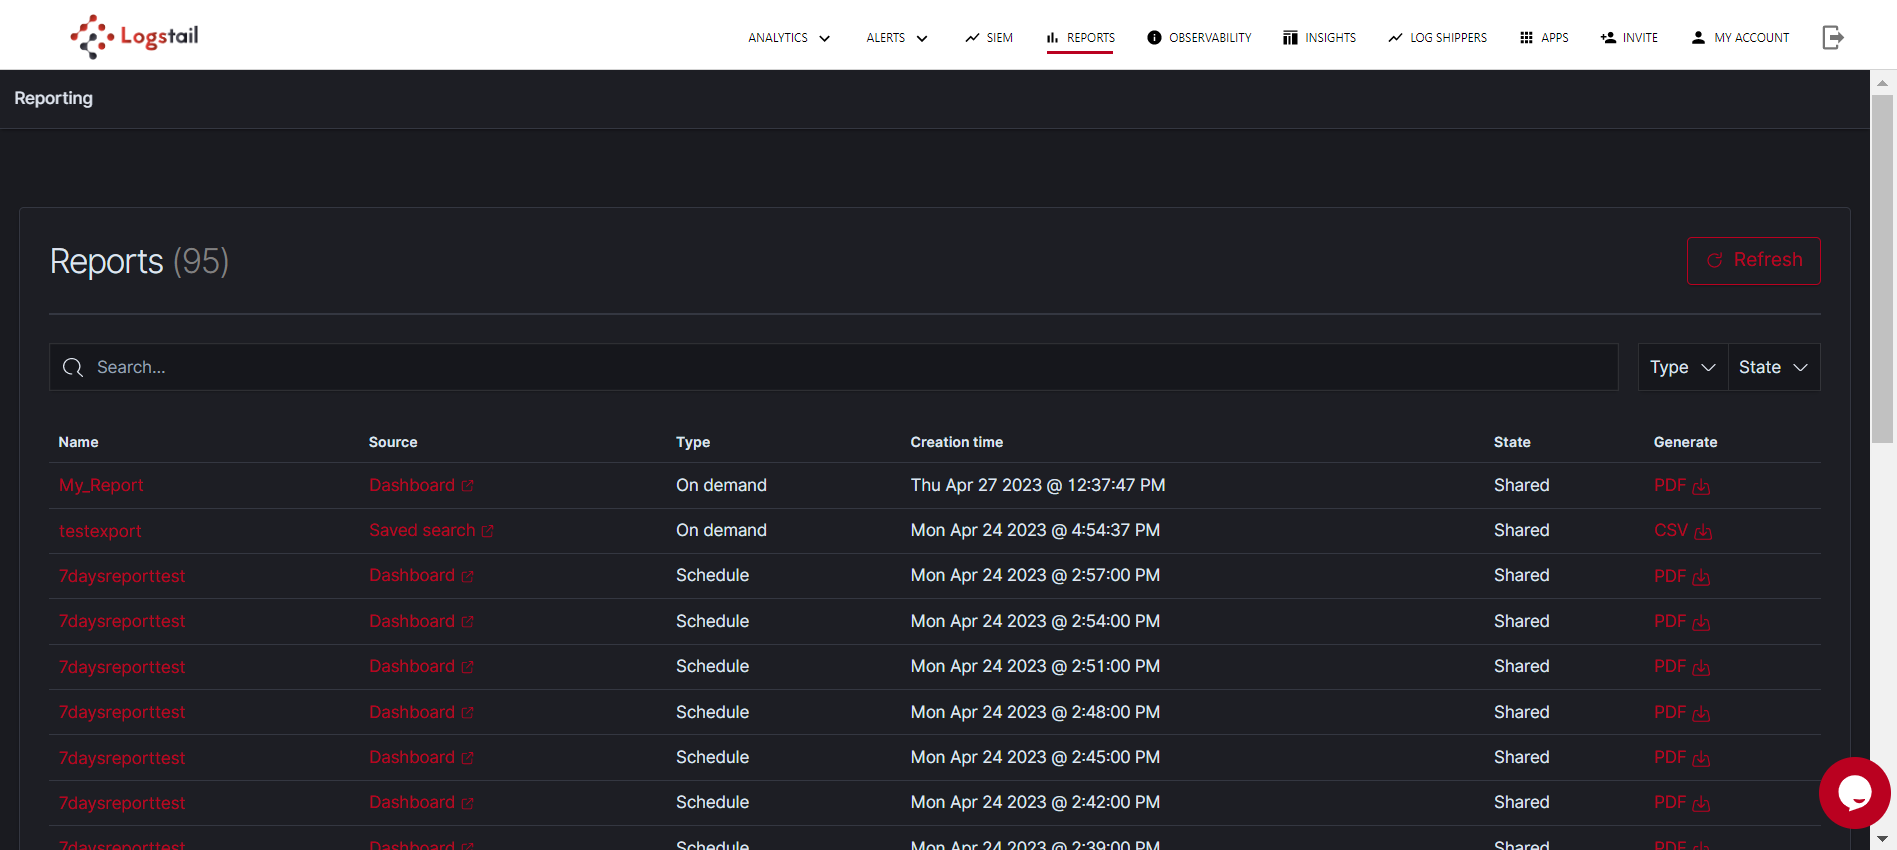
Tips
- Make sure you have allow downloads enabled in your browser.
- If Report fails to get generated try clearing your browser’s cache or generating from a Incognito session.
- Make sure you enter the correct time range for the data you wish to get a Report. Wrong time range might result to an empty Report.
If you encounter any errors or need further instructions Logstail’s Support Team would be pleased to help you.
Contact Our Experts or Sign Up for Free