
February 28, 2023
MikroTik Monitoring: Custom Graphs, AI-Powered Insights, Alerting and Reporting
What are MikroTik routers?
MikroTik is an important player in the networking industry. Its products are widely used by small businesses, service providers and other organizations looking for a reliable and cost-efficient networking solution. They emphasize affordability, flexibility, security and they integrate a wide range of powerful features such as firewall, bandwidth management, VPN, and wireless access point capabilities.
Why should you collect MikroTik logs?
MikroTik logs are an important aspect of the MikroTik RouterOS operating system, and they play a crucial role in network management and security. Logs provide valuable information about network activities, errors and other events that may be impacting network performance.
Analyze MikroTik logs.
Collecting and observing MikroTik logs mostly helps in troubleshooting problems, diagnose issues that may be affecting the network and improve performance by identifying areas where network traffic is congested or identifying bottlenecks. Security wise, logs help in identifying potential threats or detecting unauthorized access attempts which could cause data or security breaches. Nowadays, many organizations are subject to compliance requirements, such as data retention laws and regulations. MikroTik logs can help organizations comply with these requirements by providing an audit trail of network activity. Furthermore, running a historical analysis process on the MikroTik logs can provide the organization with a historical record of network activity, allowing network engineers and administrators to analyze network activity over time. This information can be used to identify patterns and trends in network usage and plan the future network capacity.
Logstail SaaS Platform contribution
Collect MikroTik logs with Logstail
As we have already analyzed in our previous post, Logstail offers the ability to collect and ship your MikroTik logs to the cloud platform by following the detailed instructions. Afterwards, you may view the gathered logs on the discovery page, where they are broken down into simpler, clearer fields, or you can check out the pre-built dashboards offered by Logstail to see how your logs are shown in a variety of ways. Visualizing logs makes it simpler for each user to make observations and draw inferences about recent activity on MikroTik Router when logs are visualized.
Logstail Reporting Plugin
The Reporting Plugin can be used to create PNG, PDF, and CSV reports. They can be used to communicate important information to a wide range of stakeholders, including executives, customers, and employees. Reports can provide valuable insights into a wide range of data sources including MikroTik logs that may not be immediately obvious. They are helpful in the decision-making process by providing relevant and timely information and presenting data about events, actions, and threats in a clear and concise manner, making it easier for organizations to improve performance and reducing the risk of errors.
Setup Reports for MikroTik logs with Logstail Report Plugin
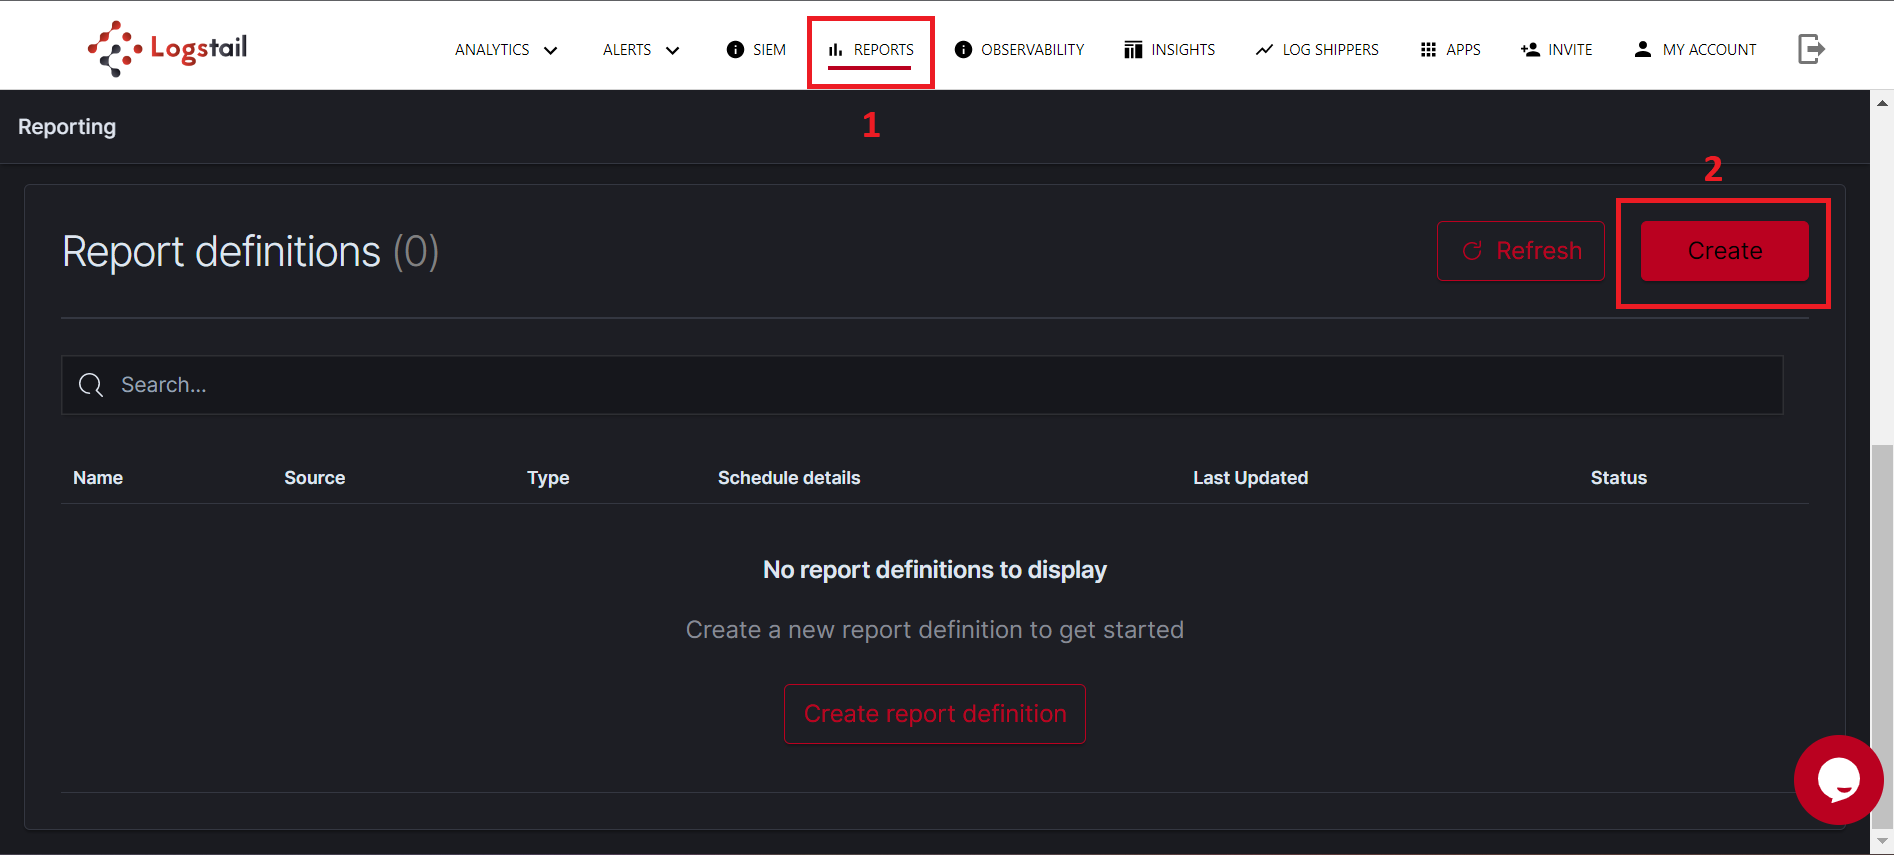
- Go to Reports plugin from top menu.
- Click on the Create button to create a new Report definition.
Create Report
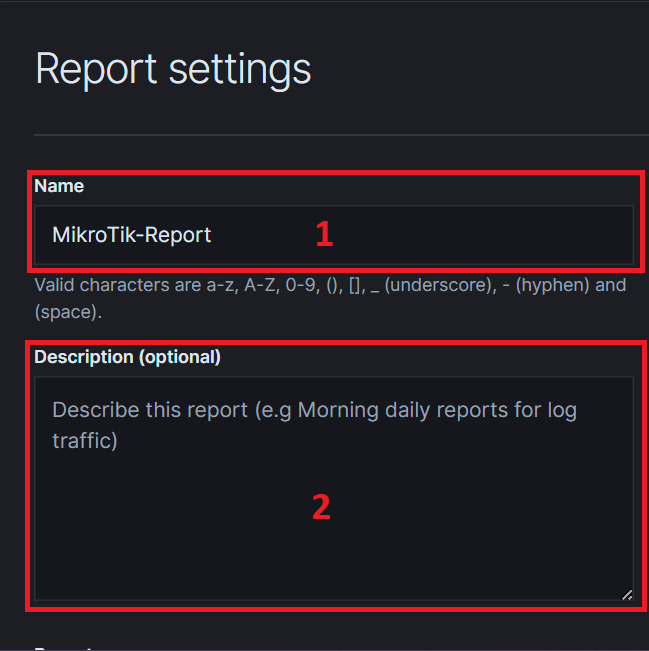
- Give your Report a name.
- Optionally you can add a description.
Name the Report
- Select the type of report you want. For the example we use Dashboard.
- Select the source. Here we select the MikroTik dashboard.
- Set the desired time range for the report.
- Choose the format you want, either PDF or PNG.

Report Settings
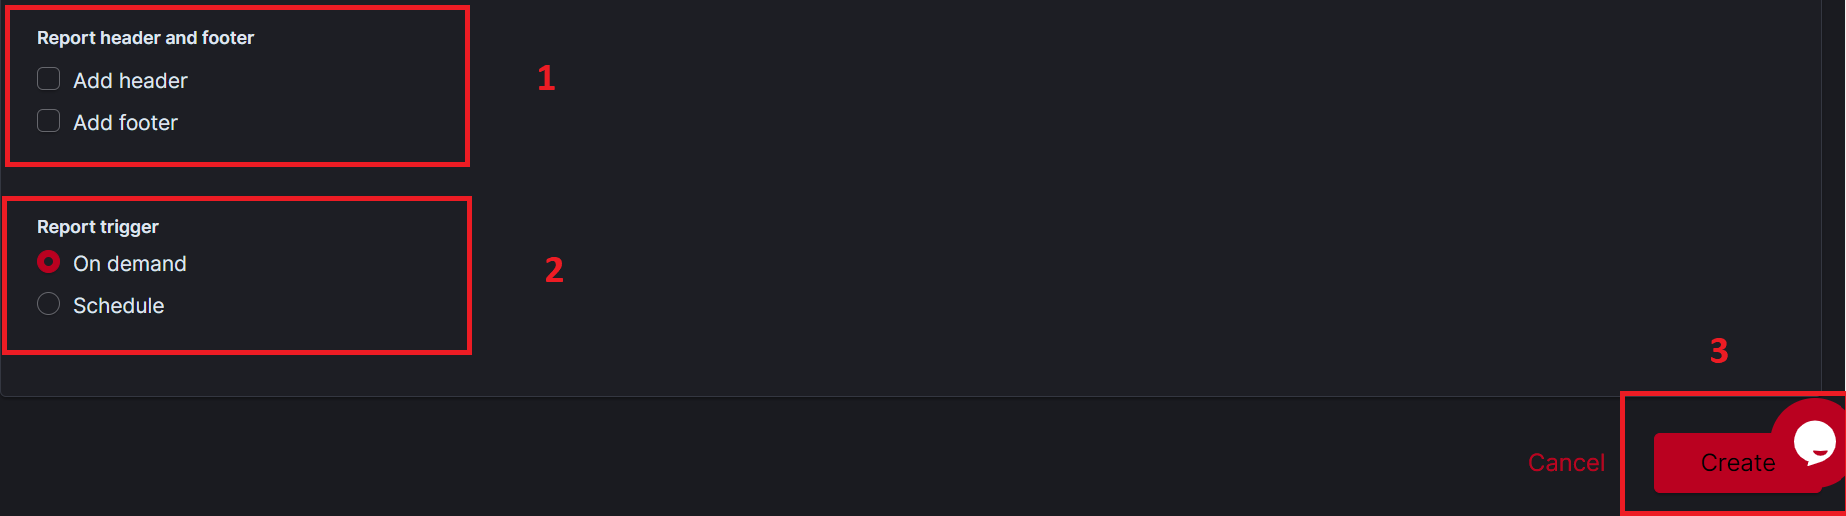
- Optionally add a header or a footer to the Report.
- Set the time you wish to get the report either instantly (On demand) or on a scheduled time.
- Click on the Create button to create the report.
Report settings
- Click on Refresh to see the updated list with the Reports.
- Click on the PDF or PNG button to download the Report.

Download Report
Logstail Insights Plugin
Insights is a powerful AI-Powered plugin. It integrates the Anomaly detection tool which is another important capability that can be leveraged through Logstail Platform and MikroTik logs. Anomaly detection involves identifying patterns or data points that deviate significantly from the norm, which may indicate unusual or potential problematic activity. It provides the user with data visualizations, such as charts and graphs. These visualizations are helpful in identifying patterns and trends that may not be immediately apparent through simple data analysis. The insights plugin is functioning in real time analyzing new ingested logs, performing predictive analytics to identify issues before that occur and automatic alerting the user in combination with the Alerting Plugin. Finally, it can be used to run a historical analysis on MikroTik logs to identify trends and patterns over time in data already ingested, which can be used to make data-driven decisions about network performance, security, and other important metrics.
Setup Anomaly-Detection for MikroTik logs using Logstail Insights Plugin
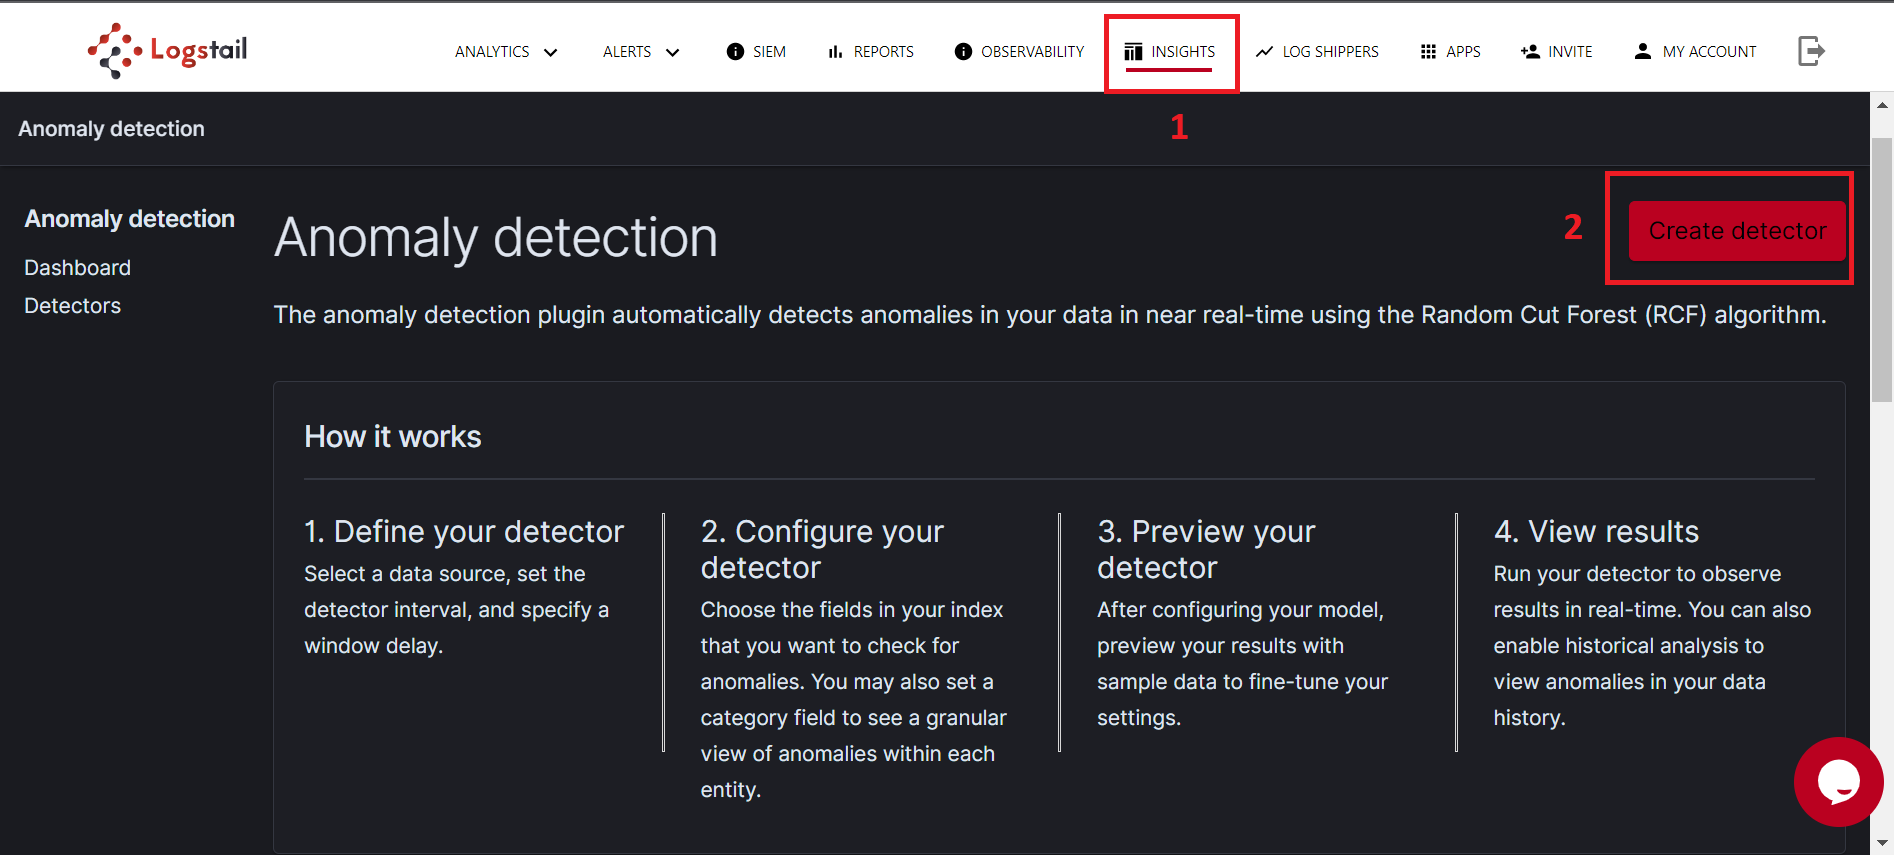
- Navigate to Insights Plugin from the top menu.
- Click on Create detector.
Create Detector
- Name your detector.
- Optionally add a description to the detector.
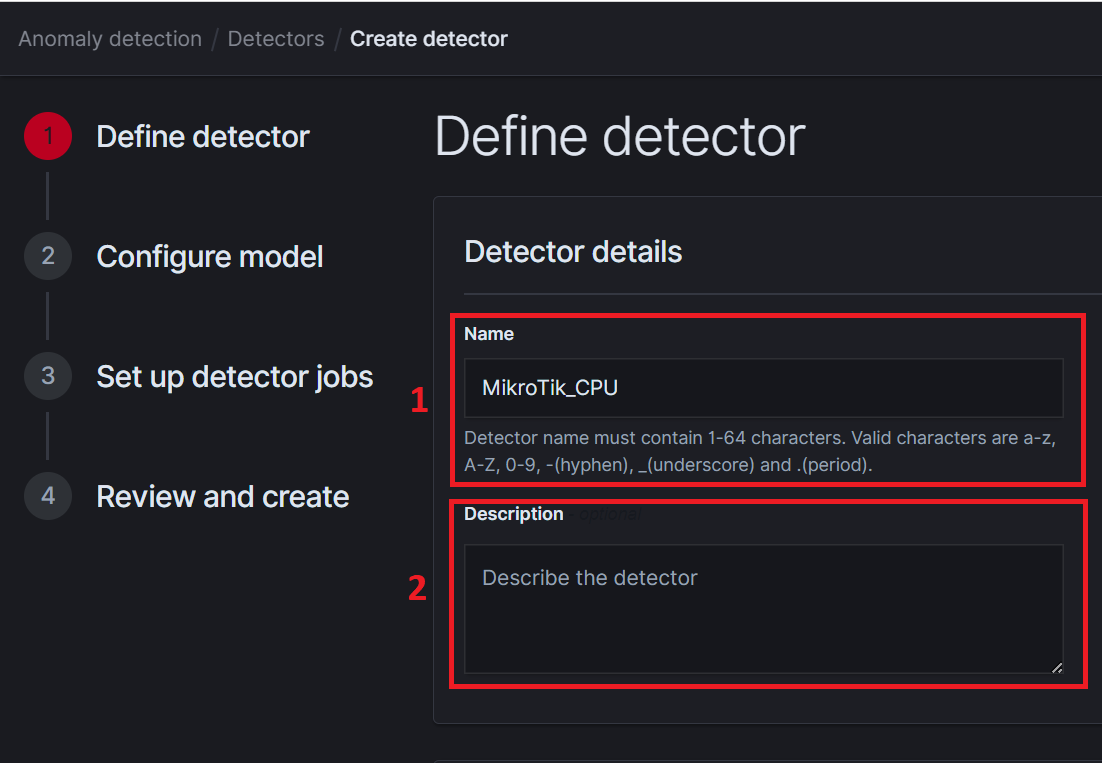
Name the detector
- Select the MikroTik index you want to run the detector on. (We recommend to use the wildcard “*” to include the logs for all the dates.)
- Optionally you add a Data filter.
- Select @timestamp for the Timestamp field.
- Click next on the bottom-right of the page.

Data Source

Timestamp
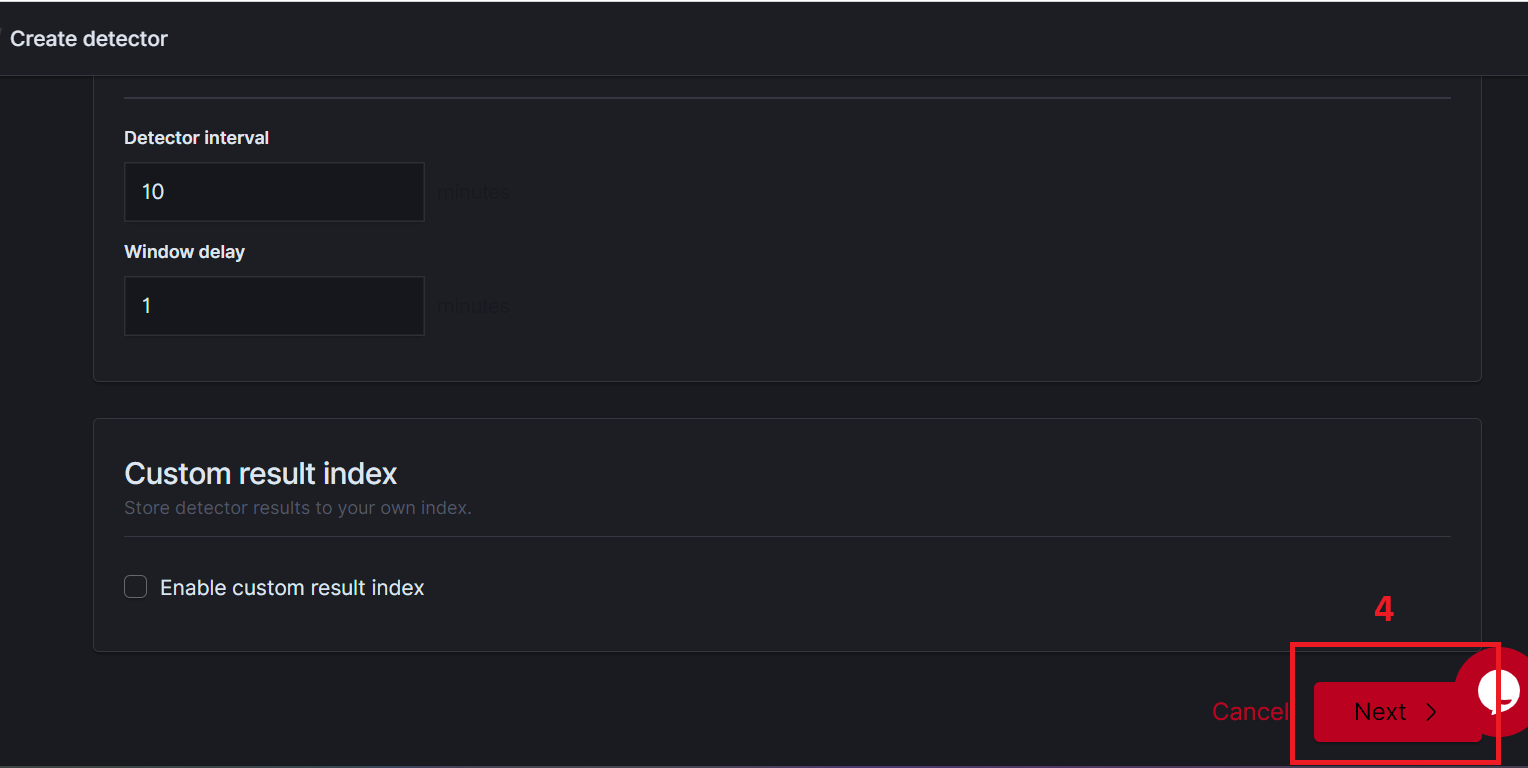
Next =>
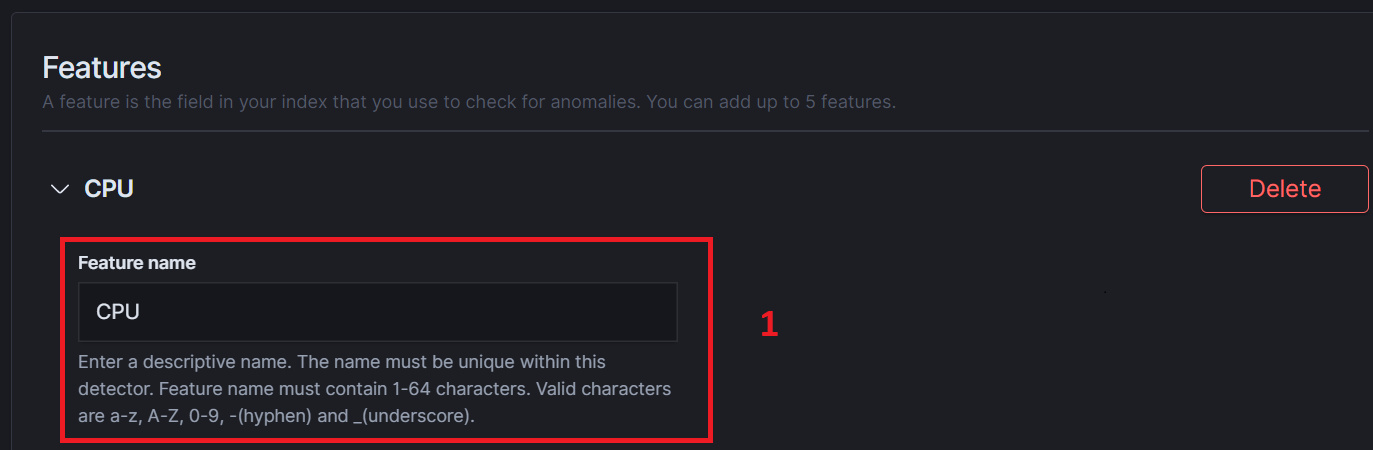
- Enter a name for your feature.
- Check the Enable feature option.
- For our example we use the Field value option.
- For our example we use max as an Aggregation method.
- For field select “cpuusage” to find anomalies based on high CPU usage.
- You can add more features to match your needs and your use case.
- Click next on the bottom-right of the page.
Feature name

Setup feature
Next =>
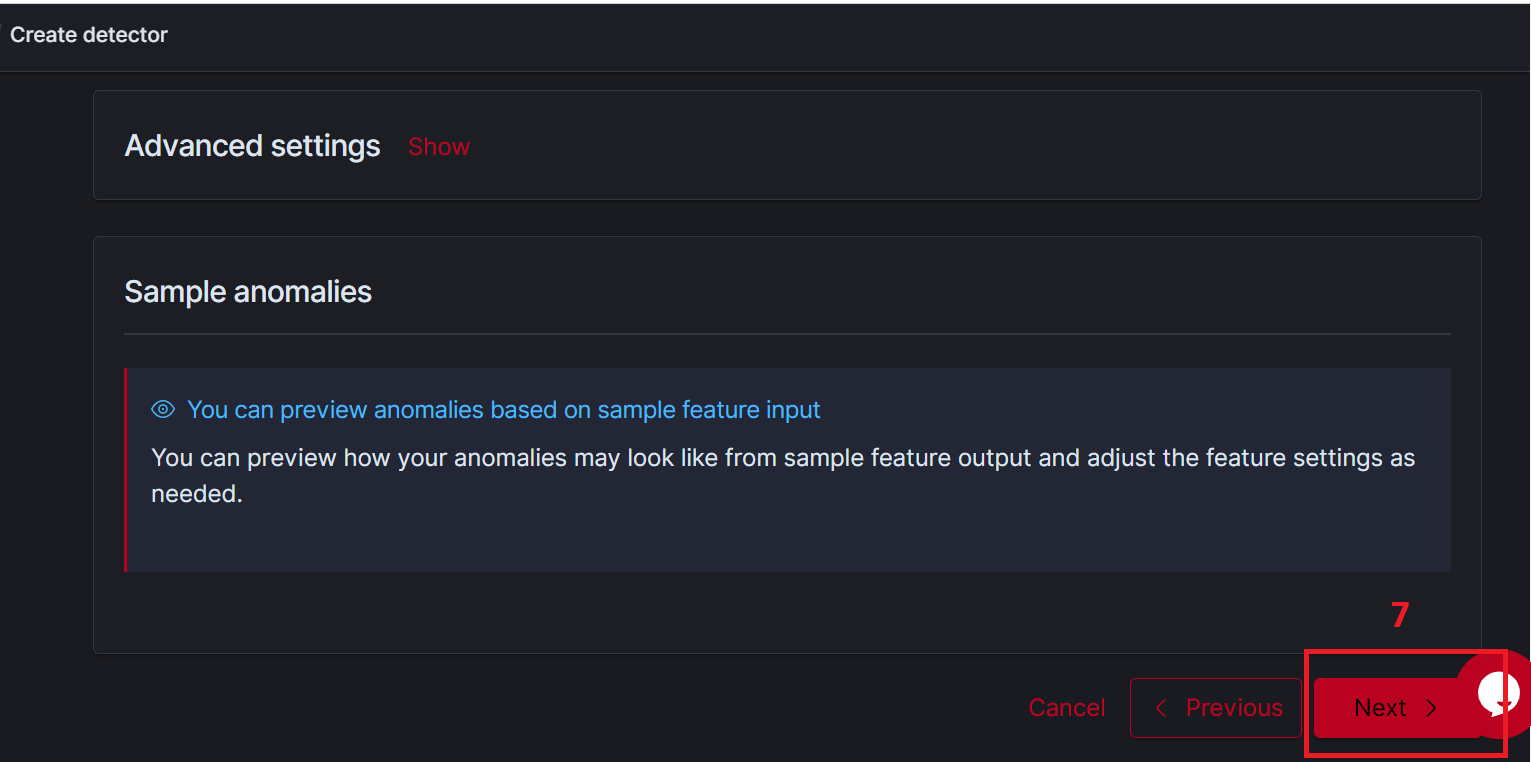
- Check the Start real-time detector automatically checkbox.
- Check the Run historical analysis detection checkbox if you want to run historical analysis to your MikroTik logs. Also select the desired time range for the analysis.
- Click next on the bottom-right of the page.
- Click Create detector on the bottom-right of the page.
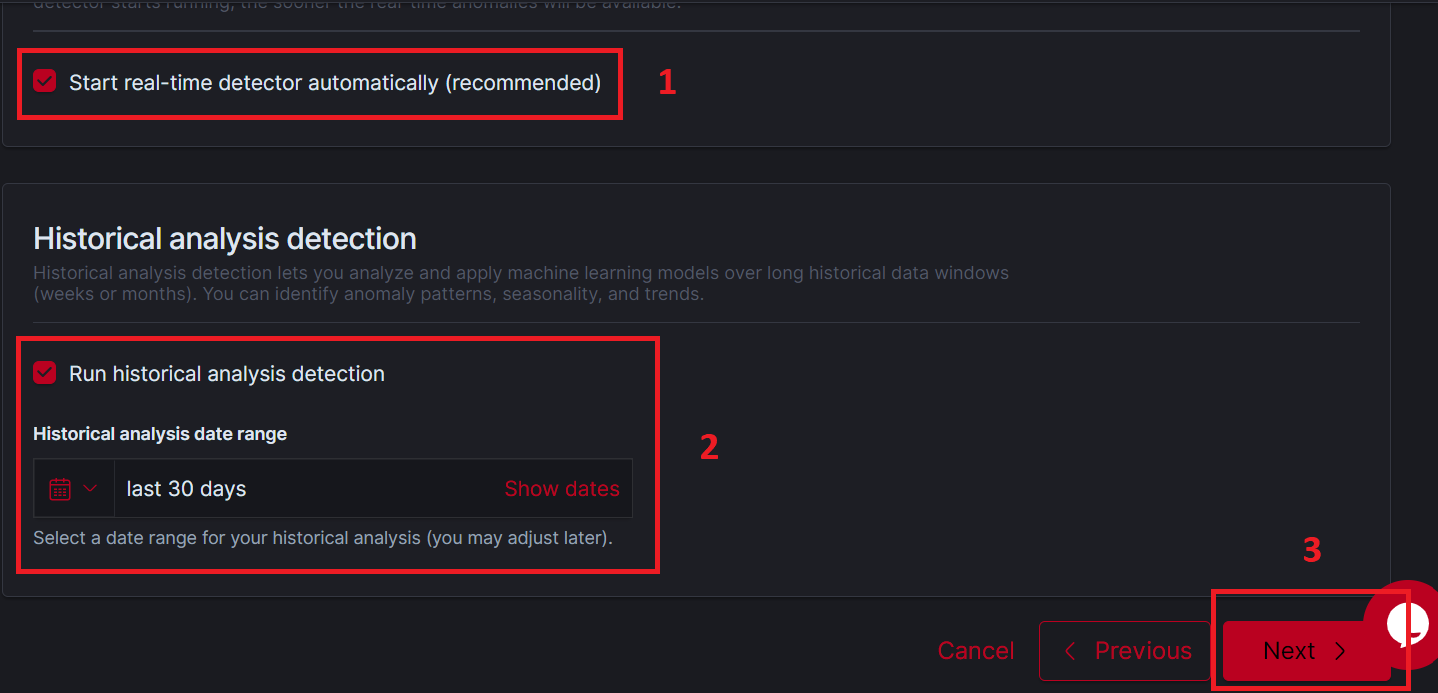
Detector Settings
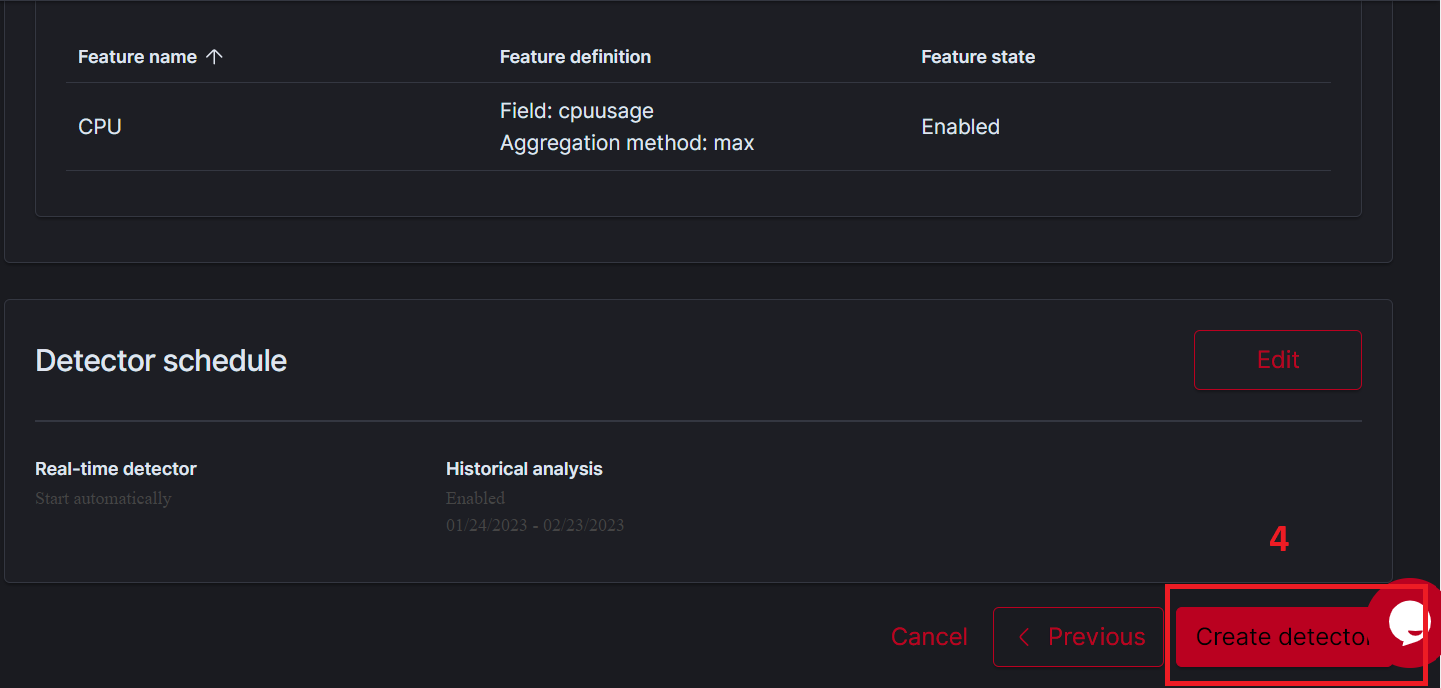
Create the Detector
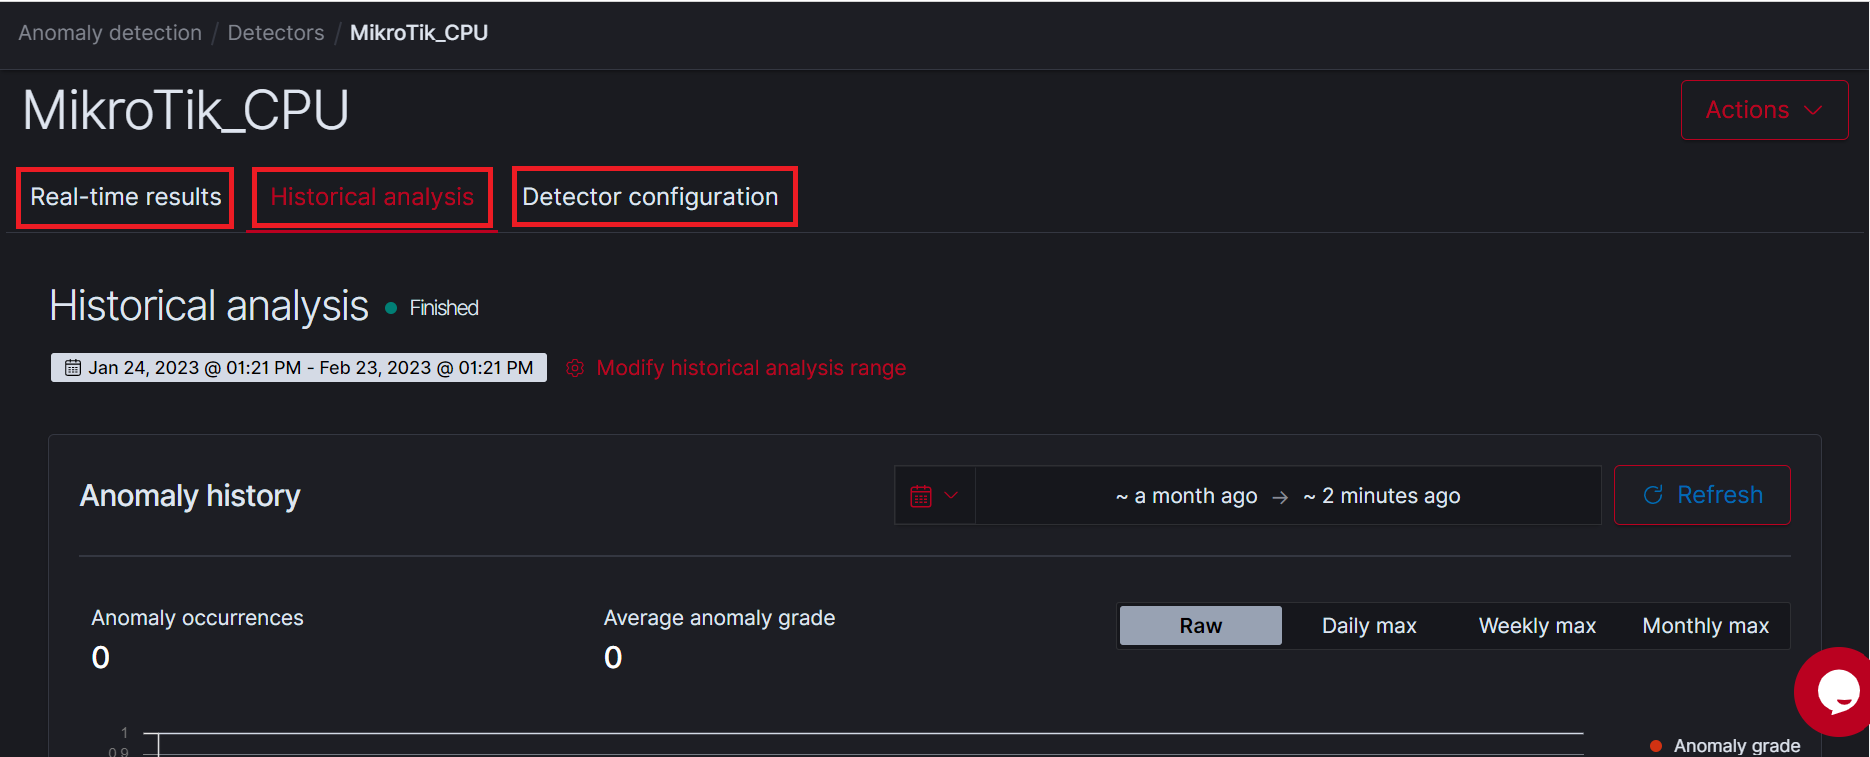
The Detector setup has finished. You can navigate in the Real-time results tab to view the anomalies detected in real time, in the Historical analysis tab to view the analysis of your data and in the Detector configuration tab to view or edit the Detector configuration.
Logstail Alerting Plugin
The Logstail Platform includes also a powerful alerting plugin. Alerting plugin can be used to create and manage alerts based on a specific condition and when conditions are met it will trigger a notification to alert the user. In the context of MikroTik logs, it can be used to monitor logs for specific events such as security threats or performance issues (high CPU usage) and when an event is detected, it will trigger an alert to notify the network administrators. The Alerting plugin has some key potential benefits when used to monitor MikroTik logs. It mainly provides real-time notifications when specified events occur, giving the opportunity to the network administrators to respond quickly and proactively to issues. Beyond that, it can be customized to meet specific needs for each customer (different notification channels, different triggers) and it can be integrated with other tools to automate notification and forward them to the required channel. Finally, it can help organizations to ensure compliance with regulatory requirements and respond to security events minimizing the risk of data breaches and other security incidents.
Setup Alerting for MikroTik logs using Logstail Alert Plugin
- Click on Alerts Plugin from the top menu.
- Click on Monitors tab -> Create monitor button to create a new monitor.
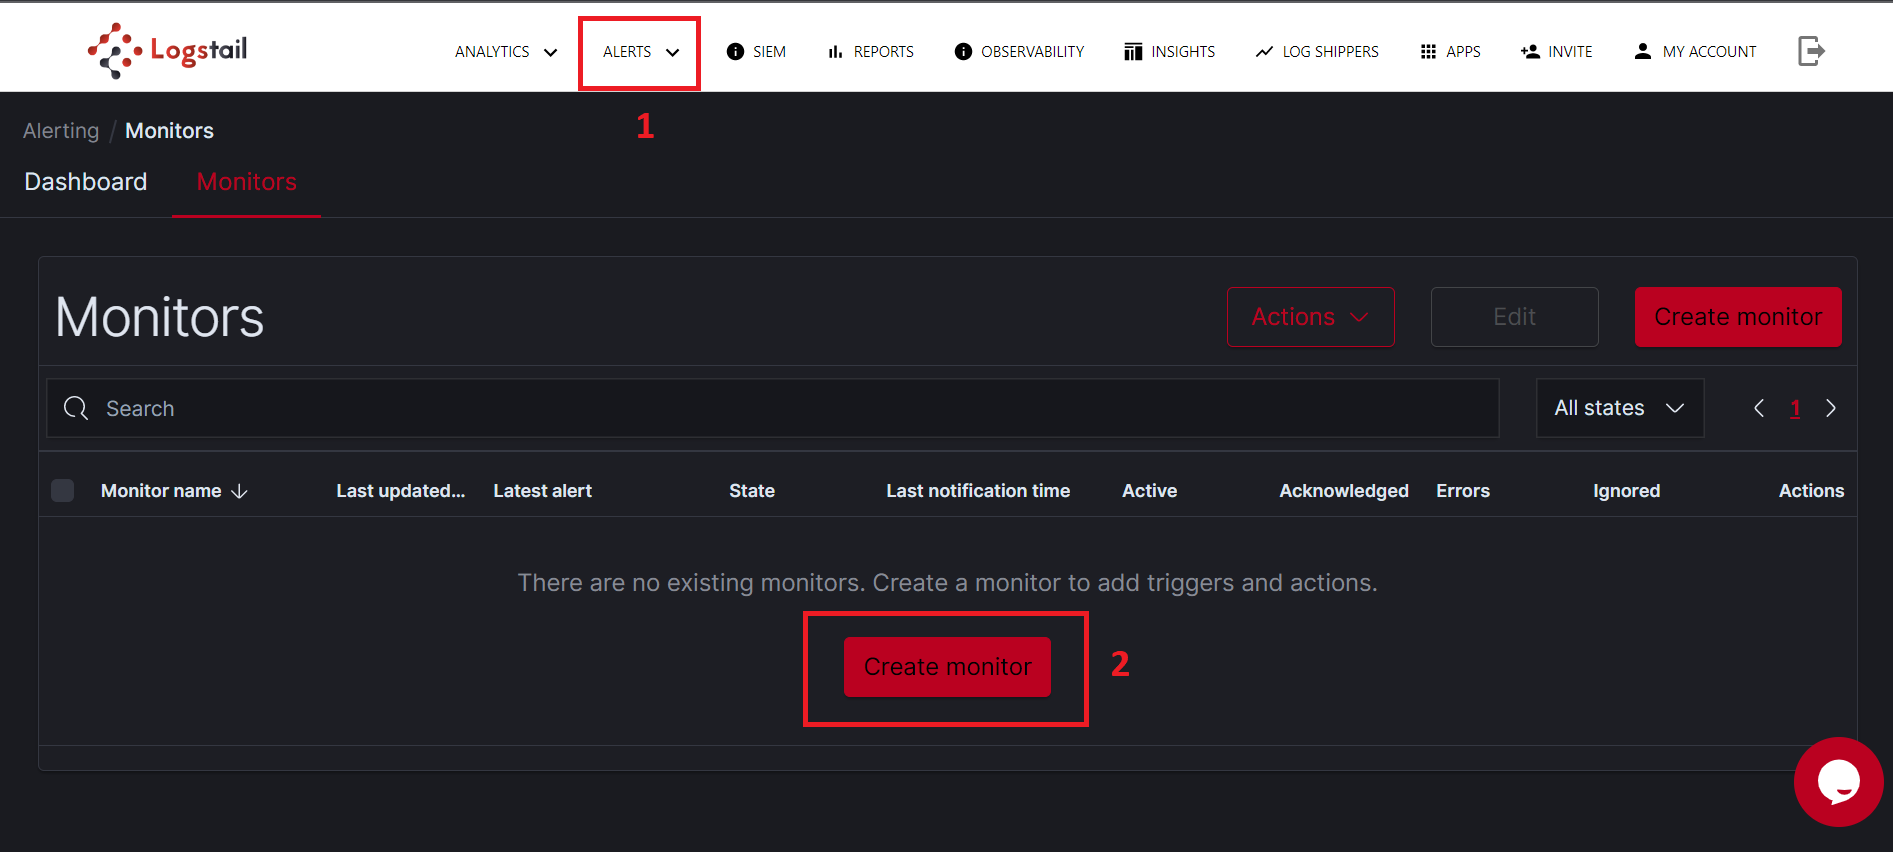
Create monitor
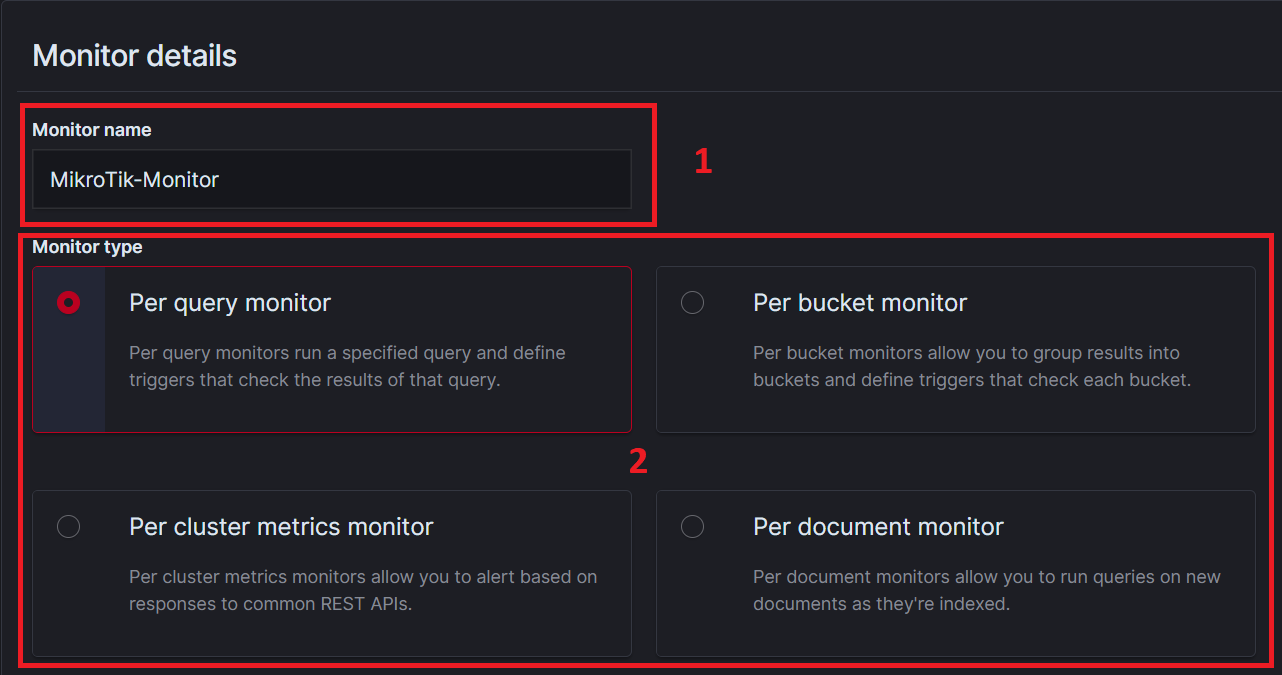
- Enter a Name for the monitor.
- Select the monitor type. For the example we are going to use “Per query monitor”.
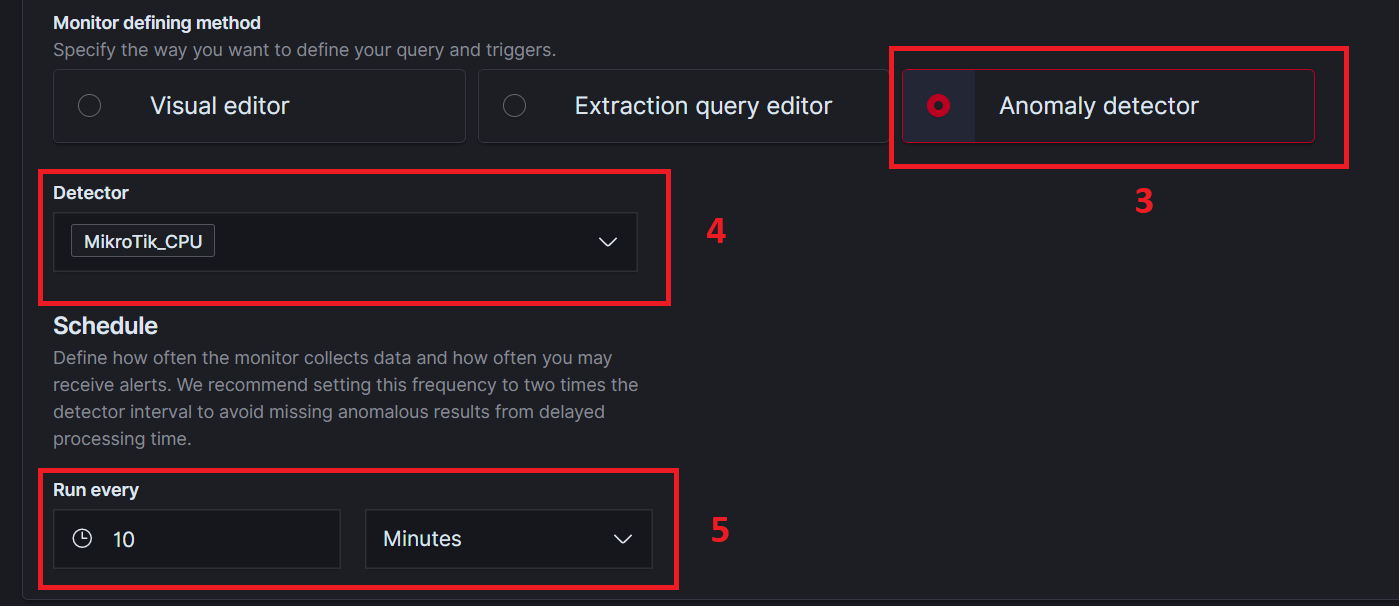
- Select the Monitor defining method. For the example we are going to use “Anomaly detector”.
- For detector we select the detector we made in the Anomaly-Detection Plugin.
- Optimize the scheduled time for your monitor.
Monitor settings
Monitor settings
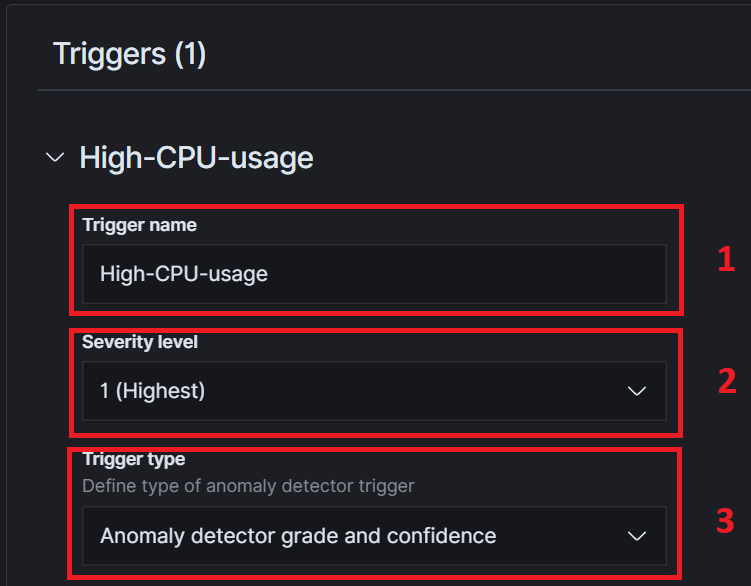
- Create a trigger and enter a name.
- Select the Severity level that matches your needs for the trigger.
- Define the trigger type.
You can add more than one trigger with different settings.
Triggers
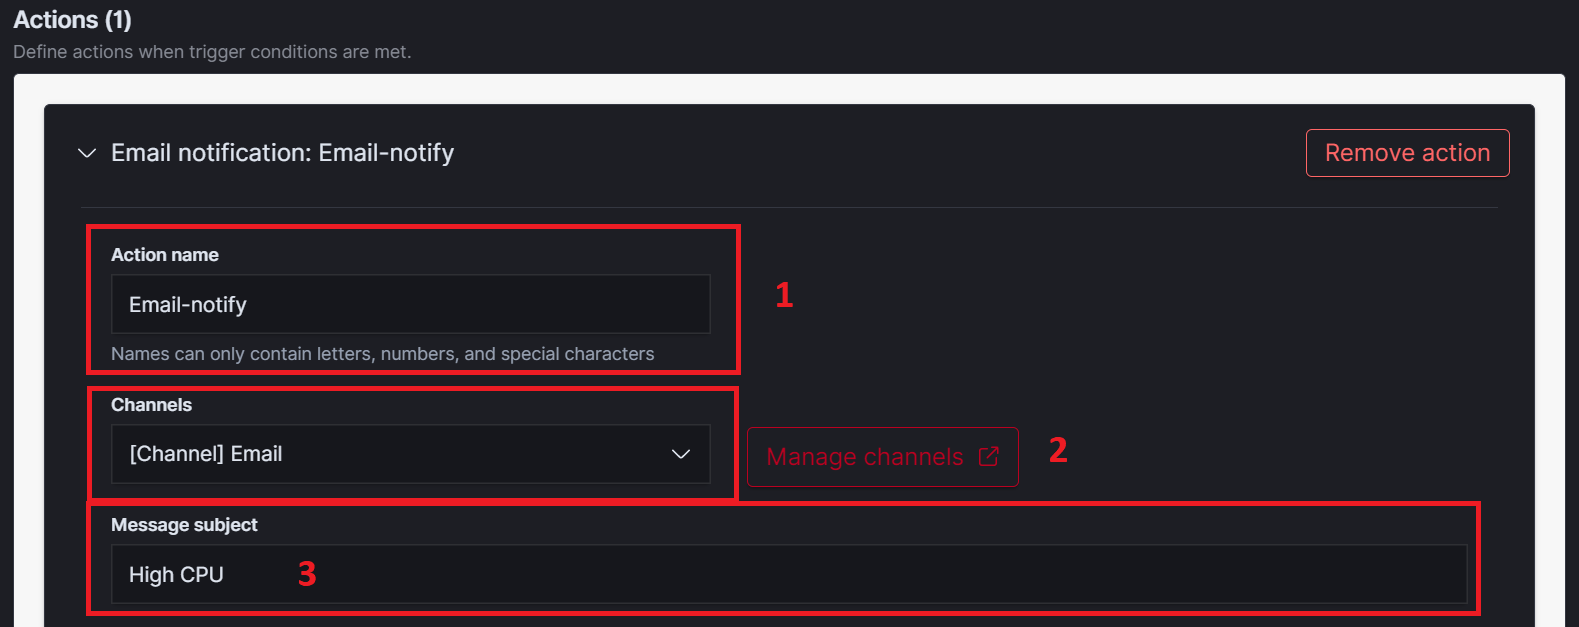
- Create a new action and enter a name for it. Actions are the way you get notified for the alerts.
- Select a channel to receive your notifications. If you don’t have configured channels, click on the Manage channels button and create one!
- Enter a subject for the message you will get for the alerts.
Optionally you can also edit the message that you are going to receive. Finally, you can add more than one action, to make sure you don’t miss any alerts!
Actions
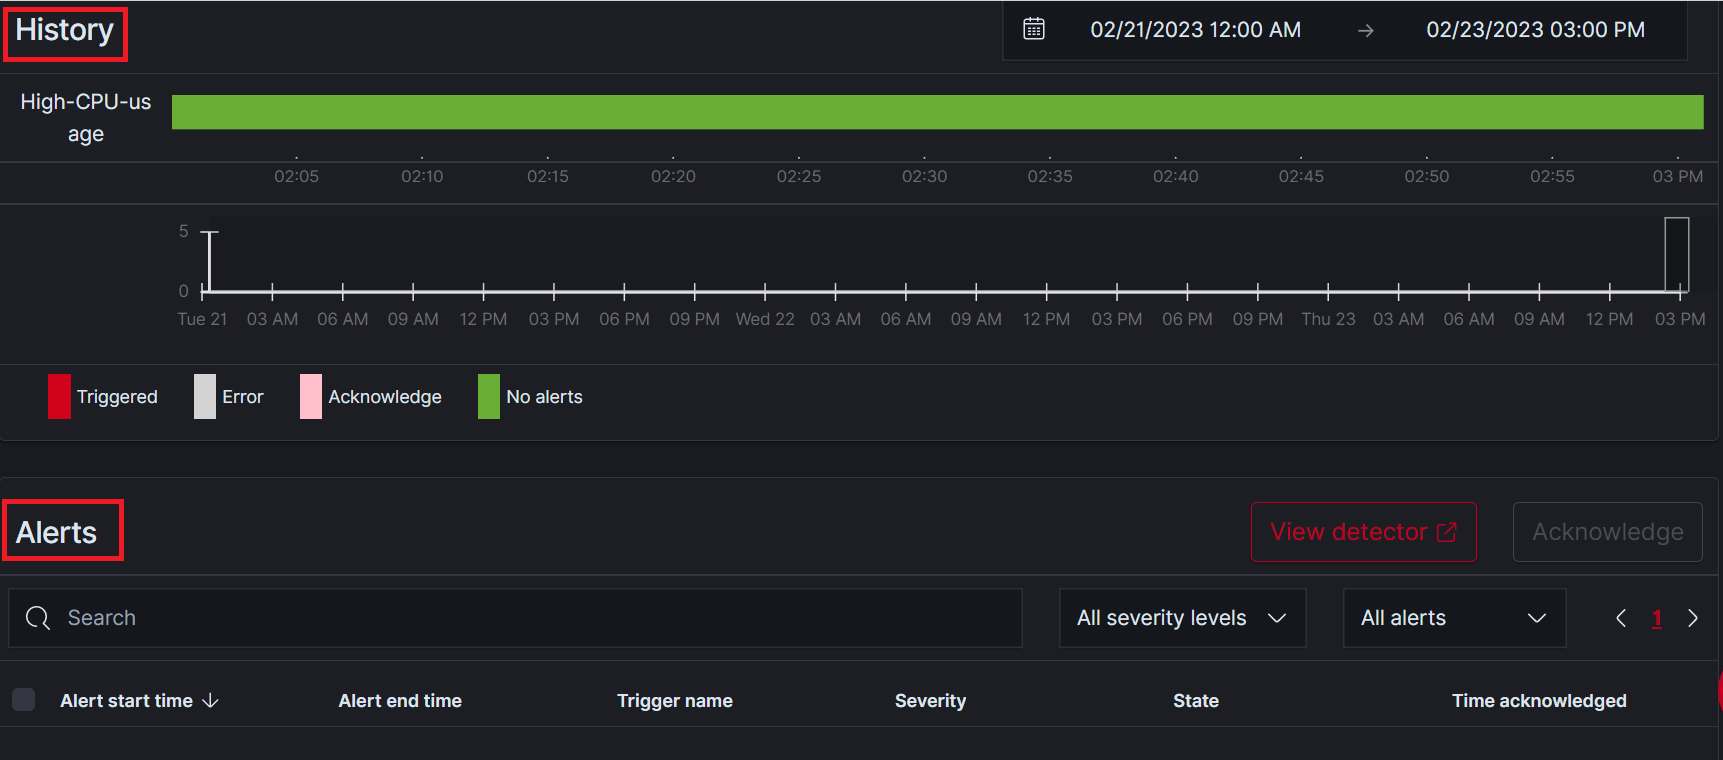
The alert monitor is ready! You can now view the alerts dashboard created to observe the History and the new Alerts listed below.
Alert dashboard
Conclusion
To sum up, analyzing MikroTik RouterOS logs can provide valuable insights into network performance, security threats and other important metrics. By leveraging the tools Logstail Platform offers, network administrators can gain deeper insights into their networks and take proactive measures to address issues as they arise. As technology continues to evolve and as malware attacks increases threatening business and individuals, it is important to leverage the tools and techniques and staying on top of these trends ensuring that networks remain secure reliable and performing at their best.