Introduction
PfSense is a robust, open-source firewall and routing software that stands as a stalwart guardian for network security. It’s a feature-rich platform that offers firewall protection, VPN connectivity, traffic shaping, and much more, making it an integral part of network infrastructures across various industries. Monitoring pfSense logs is crucial for several reasons. Firstly, it provides a window into the health and security of your network. By analyzing these logs, administrators can detect and respond to potential security threats, unauthorized access attempts, or unusual network activities. This proactive approach helps in identifying vulnerabilities and fortifying defenses before they can be exploited. Additionally, monitoring pfSense logs aids in troubleshooting network issues. Logs provide valuable insights into connectivity problems, errors, or performance bottlenecks, enabling administrators to swiftly diagnose and resolve issues. It’s akin to having a diagnostic tool that pinpoints the root cause of problems, thereby ensuring smoother network operations. Overall, the thorough observation of pfSense logs isn’t just a best practice; it’s a fundamental aspect of maintaining a secure, optimized, and resilient network infrastructure. Monitoring pfSense with Logstail offers a streamlined and efficient way to keep a watchful eye on your network’s health and security. Logstail serves as a powerful log management tool that integrates seamlessly with pfSense, allowing administrators to gather, parse, and analyze logs in real-time. By leveraging Logstail’s capabilities, users can create tailored dashboards, set up alerts for specific events or anomalies, and gain valuable insights into network traffic, system performance, and potential security threats. This integration empowers administrators to make informed decisions swiftly, enhancing the overall security posture and operational efficiency of their network infrastructure.
Setup pfSense to ship logs to Logstail
- First youneed to install syslog-ng package. This can be done under System→ Package Manager→ Available Package

- Add and save the Logstail Public Certificate to pfSense, this can be done under System → Certificates → Authorities → Click +Add
- After Installation completed go to Services→ Syslog-ng and enable service on loopback interface with all settings as default and click SAVE.

- Continue to Advanced Tab of Syslog-ng service and create four new objects (source, destination, rewrite, log)
First Object will be a Source Object with parameters as below:
-
- Object Name → LogstailSource
- Object Type → Source
- Object Parameters → { syslog(transport(udp) port(5141) ip(127.0.0.1)); };
 Second Object will be a Rewrite Object with parameters as below:
- Object Name → LogstailRewrite
- Object Type → Rewrite
- Object Parameters →
{ set(“AddYourPfSenseHostname”, value(“HOST”)); set(“$MESSAGE,add-your-logstail-token”, value(“MESSAGE”)); };
BE CAREFUL YOUR TOKEN MUST BE NEXT TO THE MESSAGE AFTER THE “,” WITHOUT ANY WHITESPACE REMEMBER TO ALSO CHANGE YOUR HOSTNAME
 Third Object will be a Destination Object with parameters as below:
- Object Name → LogstailTLSDestination
- Object Type → Destination
- Object Parameters →
{ tcp(“apps.logstail.com” port(35727) tls(peer-verify(optional-untrusted))); }; Finally create a Log Object with parameters as below:
- Object Name → LogstailTLSDestination
- Object Type → Destination
- Object Parameters →
{ source(LogstailSource); rewrite(LogstailRewrite); destination(LogstailTLSDestination); }; 
- Enable logging for pfSense appliance to Logstail Platform going through Syslog-ng Service. This can be done by configuring under Status → System Logs → Settings the Remote Logging Options as below:
- Click the checkbox next to Enable Remote Logging option
- On Remote log servers option add 127.0.0.1:5141
- And on Remote Syslog Contents option check Everything and SAVE
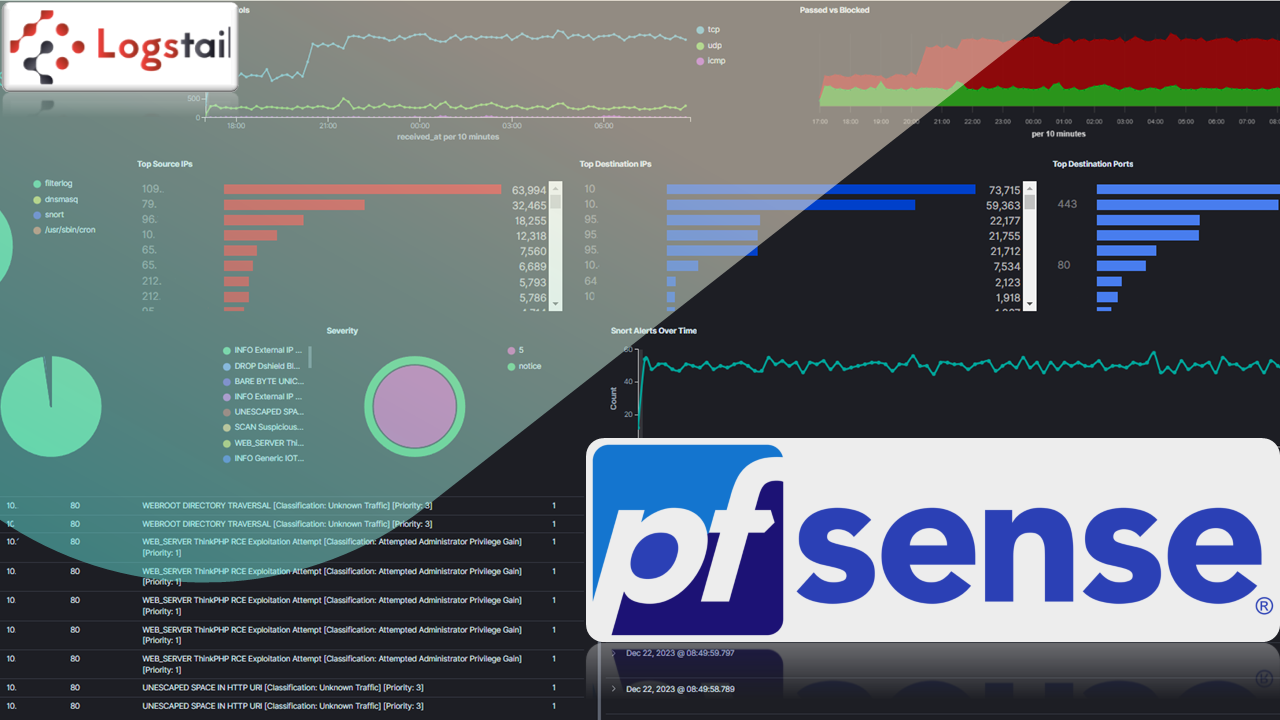
View your data

- Go to Analytics → Dashboards → PfSense Dashboard and observe your data!

Snort Dashboard
Also clicking on the IDS will redirect you to the pfSense Snort Dashboard, designed to enhance network security monitoring and threat management. This dashboard dynamically displays Snort alerts in real-time, providing administrators with a comprehensive overview of network traffic and potential security threats. Key features include:
- Priority Levels
- Snort Alerts
- Source and Destination IPs as external urls to abuse IP for instant lookup.
NOTE: Open the Urls to a new tab!

Alerting
Alerting is an extremely useful feature provided by Logstail. We provide you a mechanism to receive alerts when certain indicators exceed the thresholds been defined. An important part of any log management system is alerting. Rather than searching log data for specific events, our platform offers the alerting functionality. Logstail has the ability to save your searches on a schedule that is determined buy you and send messages or emails when alerts are being triggered. Setting up Logstail’s alerting feature to receive alerts for Snort Priority 1 threat, ensures you’re immediately notified of critical security incidents and empowers you to stay ahead of severe security threats, maintaining your network’s integrity and protecting sensitive data with proactive alerting on critical issues detected by Snort.
- Go to Alerts → Alerting Dashboards → Create Monitor.
- Enter the Monitor Name → Per query monitor → Extraction query editor.
- We setup this monitor to run every 2 minutes.
- For data source we select the logstail-pfsense-*. We use wildcard in order for the monitor to run on every index of each day.

- Add the below code in the query field. The code runs for priority 1 Alerts by snort. Change the priority values in order to customize it to your needs!
{ “size”: 1, “query”: { “bool”: { “filter”: [ { “bool”: { “should”: [ { “match_phrase”: { “@message”: { “query”: “*Priority: 1*”, “slop”: 0, “zero_terms_query”: “NONE”, “boost”: 1 } } } ], “adjust_pure_negative”: true, “minimum_should_match”: “1”, “boost”: 1 } }, { “range”: { “received_at”: { “from”: “now-2m”, “to”: null, “include_lower”: true, “include_upper”: true, “boost”: 1 } } } ], “adjust_pure_negative”: true, “boost”: 1 } } }
- Create a trigger → Give it a name
- As trigger condition we keep the default which will run when our query match at least 1 event in the last 2 minutes.
- Create a new action → Add a name → Select your notification channel
- Add a message subject
- As message body we use the following code which will email is the index name, the source IP and Port of the attack, destination IP and Port and the Host.
Details {{#ctx.results.0.hits.hits}} – Index: {{_index}} – Description: {{_source.reason}} – Source: {{_source.src_ip}}:{{_source.src_port}} – Destination IP: {{_source.dest_ip}}:{{_source.dest_port}} – Host: {{_source.@source_host}} {{/ctx.results.0.hits.hits}}
The monitor is now ready and will alert you whenever your condition is met!  If you’re encountering hurdles setting up pfSense or facing issues with logs not appearing on the Logstail platform, we’re here to assist you every step of the way. Our dedicated support team is committed to ensuring a smooth and secure network experience for you. Whether it’s navigating the intricacies of pfSense configurations or troubleshooting log visibility on Logstail, reach out to us without hesitation. Your network’s security and performance are our priority, and we’re ready to provide prompt and comprehensive assistance to resolve any challenges you might encounter.
Contact Our Experts or Sign Up for Free


