December 5, 2022
What is OpenTelemetry pt.2: Instrumentation
Introduction
In the first part of this article, we talked about the basics of OpenTelemetry. We talked about what it is, what is its current state and what it consists of. In this second part we will stay on the topic of instrumentation. Specifically, we will talk about the positives and negatives of manual and automatic instrumentation, and we will give some recommendations about it.
Automatic vs Manual Instrumentation
Instrumentation is the ability of OpenTelemetry to emit well-formatted spans with proper context. Although in most software frameworks you can instrument the application manually, some frameworks offer automatic instrumentation.
The manual instrumentation happens by adding code data to start and finish the span, specify the payload and submit the span data. On the other hand, automatic instrumentation saves the user the need to modify the application code for many use cases and provides baseline telemetry. You can use automatic and manual instrumentations combined.
Manual Instrumentation
To manually instrument an application, the user must add code to an application to start and finish a span an define the payload. It uses client libraries and SDKs, which are available for many different programming languages. These are: Java, .Net, C++, Golang, Python, Node.js, PHP, Ruby, Rust Swift, Erlang and NestJS. Manual instrumentation has both positives and negatives.
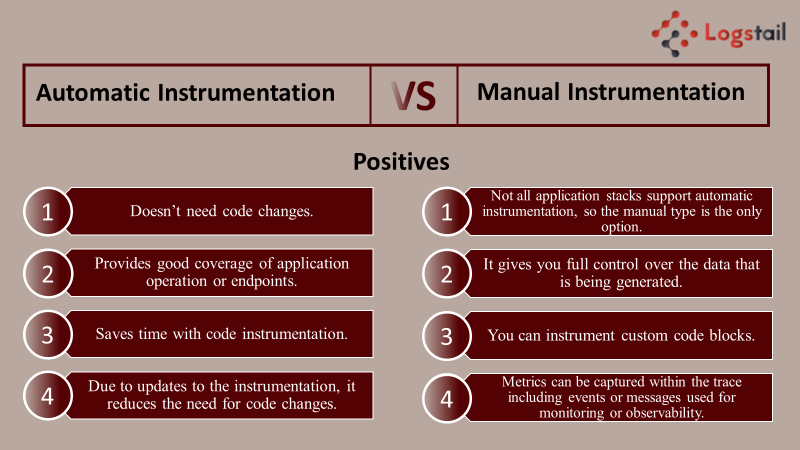
- Positives:
- Not all application stacks support automatic instrumentation, so the manual type is the only option.
- It gives you full control over the data that is being generated.
- You can instrument custom code blocks.
- Metrics can be captured within the trace including events or messages used for monitoring or observability.
- Negatives
- It is time consuming.
- Its perfection is challenging.
- Can cause performance overhead.
- Human errors are more common, which can result in broken span context.
- Change of the instrumentation may require recompiling of the application.
Automatic Instrumentation
Automatic instrumentation doesn’t need code changes or recompilation of the application. In this method, an intelligent agent attaches to the running application and extracts tracing data. Auto-instrumentation agents can be found in well-known programming languages, such as Java, Python, .NET, and PHP. Common frameworks and libraries for these languages offer built-in instrumentations.
You can reduce coding instrumentation through service meshes via their sidecar proxy or eBPF via Linux kernel instrumentation. If you use ORM libraries (such as Hibernate), you can use SQLCommenter to auto-instrument these libraries and enable database observability. Let’s see the benefits and drawbacks of automatic instrumentation:
- Positives
- Doesn’t need code changes.
- Provides good coverage of application operation or endpoints.
- Saves time with code instrumentation.
- Due to updates to the instrumentation, it reduces the need for code changes.
- Negatives
- It is not provided by all languages and frameworks.
- It is a less flexible method than manual instrumentation.
- The only metrics that you can automatically instrument are basic metrics regarding usage and performance.
- It often captures only data regarding related events or logs within a trace.
Instrumentation Recommendations
Here are some tips about instrumentations:
- Identify the tools in your stack that provide built-in instrumentation and enable it for infrastructure baseline traces.
- Utilize auto-instrumentation as much as possible.
- Use manual instrumentation if automatic instrumentation can’t be used. In fact, it is recommended to use both methods combined.
- Verify the release as well as the maturity level of every component you use.
Conclusion
With this article, we completed the two-part basic guide for OpenTelemetry. In the second part we talked about instrumentations. We analyzed the automatic and manual instrumentation and their positives and negatives. Finally, we also offered some tips about them.
Logstail provides a complete log management solution which is necessary for every organization and brings this functionality to your hands. Now you can convert your data into actionable insights with just some tweaks and prevent performance and security issues. You can maximize the performance of your infrastructure or be notified of potential problems to take the appropriate actions.
In Logstail we are also offering the full range of services required to effectively mitigate cyber-attacks. Incident response and consulting, penetration testing and red team operations are aiming to help our customers reduce their cyber incidents. Sign-up for a free demo to realize the power of Logstail!