April 27, 2020
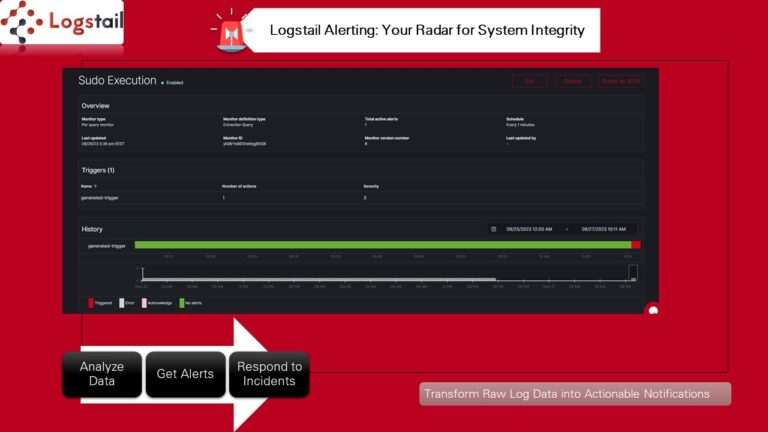
Logstail Alerting Feature

Introduction
Alerting is an extremely useful feature provided by Logstail. We provide you a mechanism to receive alerts when certain indicators exceed the thresholds been defined. But what is alerting and how useful is for your daily operations? In this article, we will explain the basic terms our platform is using and how you can make the most out of it!
An important part of any log management system is alerting. Rather than searching log data for specific events, our platform offers the alerting functionality. Logstail has the ability to save your searches on a schedule that is determined bu you and send messages or emails when alerts are being triggered.
Now you have the ability to be immediately notified for performance or other issues and take the appropriate measures to mitigate the problem. This functionality is a must when you want to have real-time operational awareness of your systems.
In this article, we will demonstrate how the alerting mechanism is functioning, but before doing we will explain the basic terms, which are:
- Destinations
- Monitors
- Triggers
- Actions
- Alerts
- Dashboards
Basic Terms Explanation
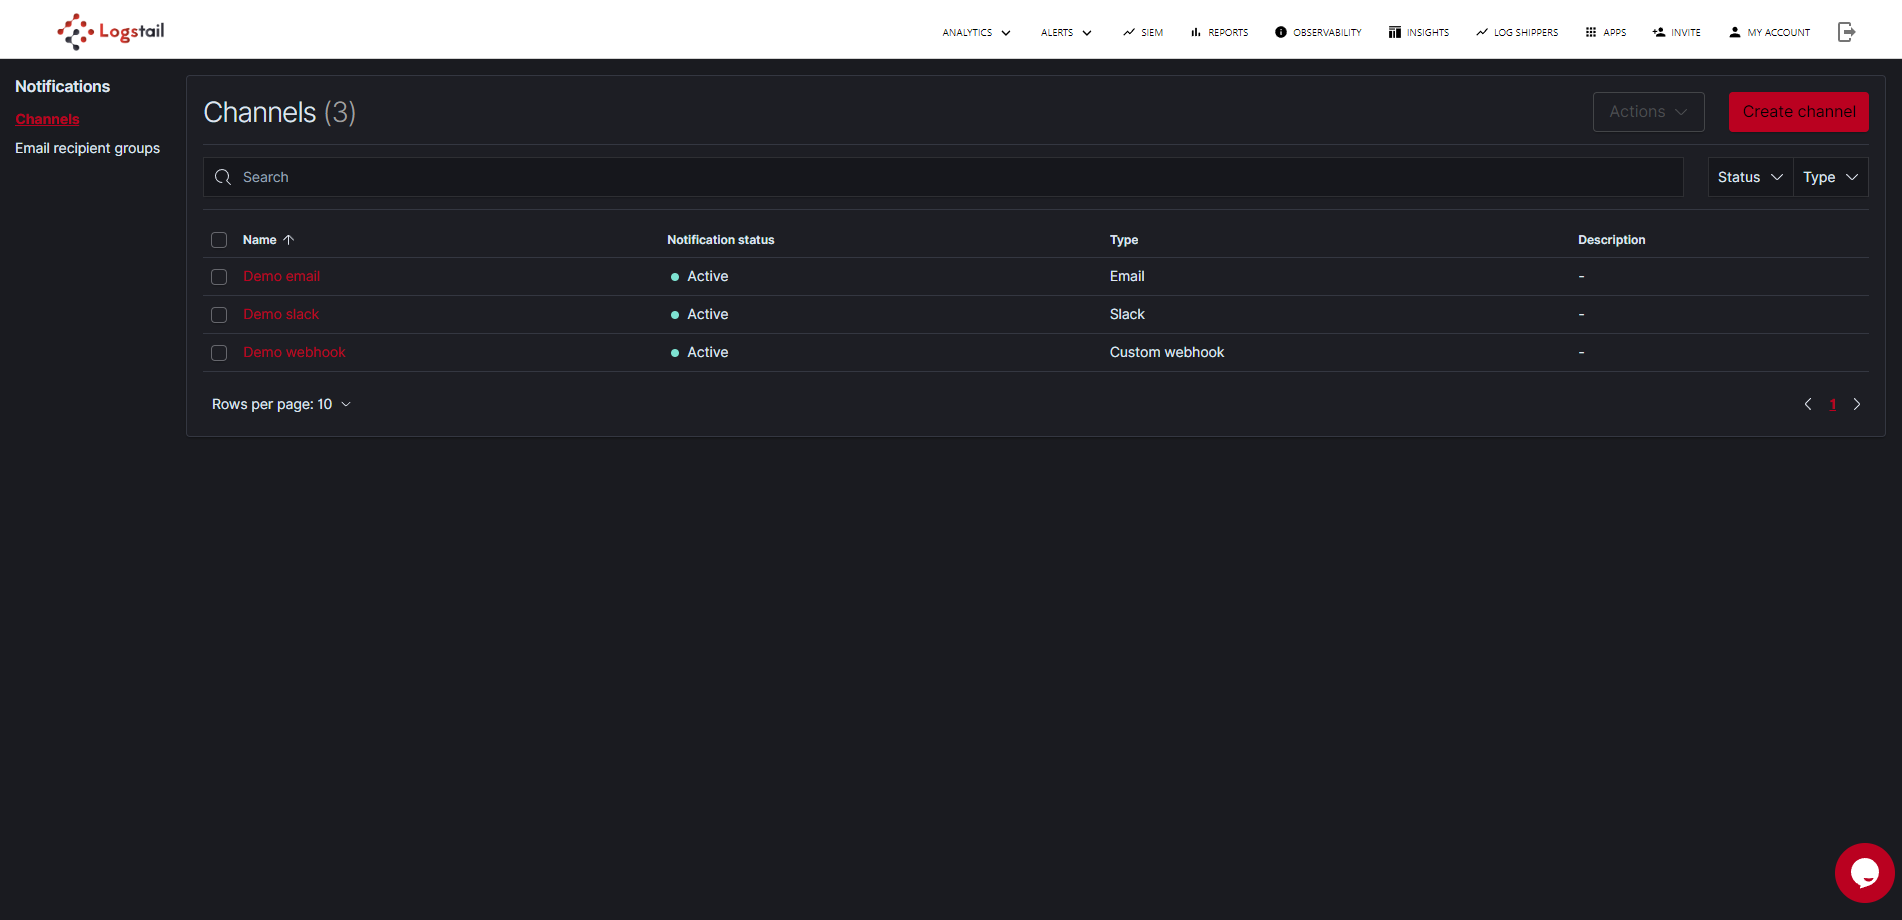
1) Destinations
Channels are the reusable locations for an action, such as email, Slack, Amazon Chime, or a webhook URL.
To setup a new Alerting Channel go to top navigation menu and select Alerts → Alerting Channels
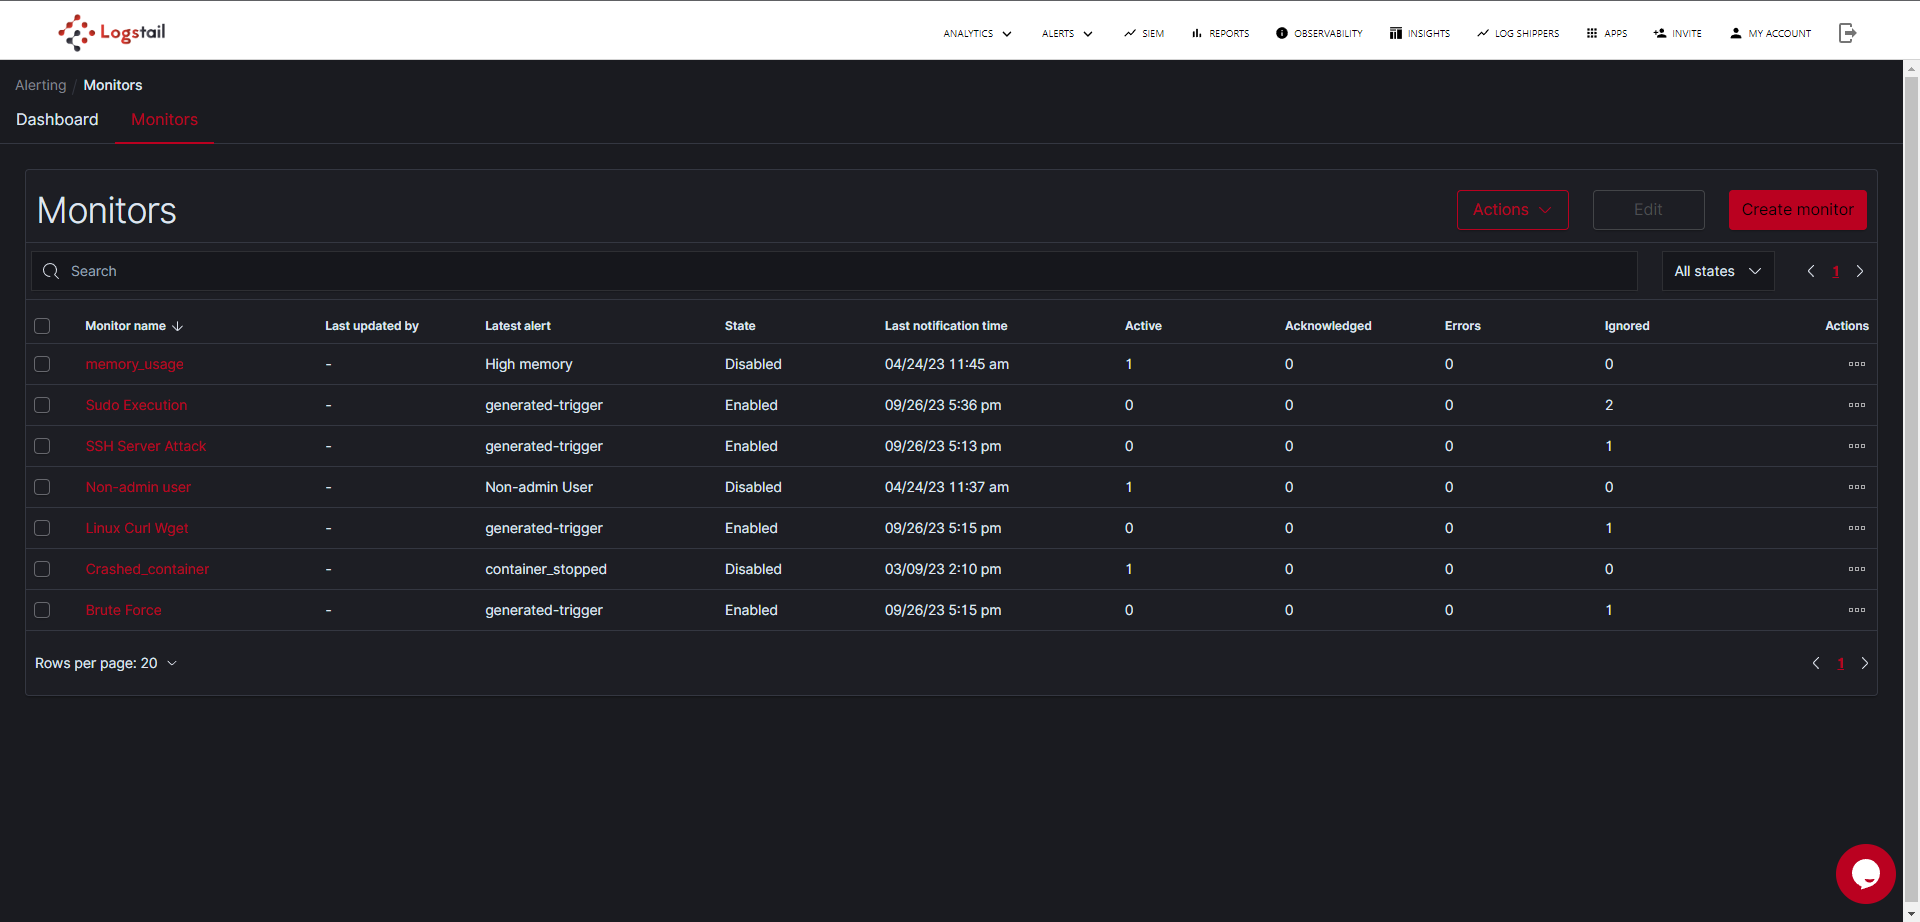
2) Monitors
Monitors are jobs running on a defined schedule and query Logstail.com. The results of these queries are then used as input for one or more triggers.
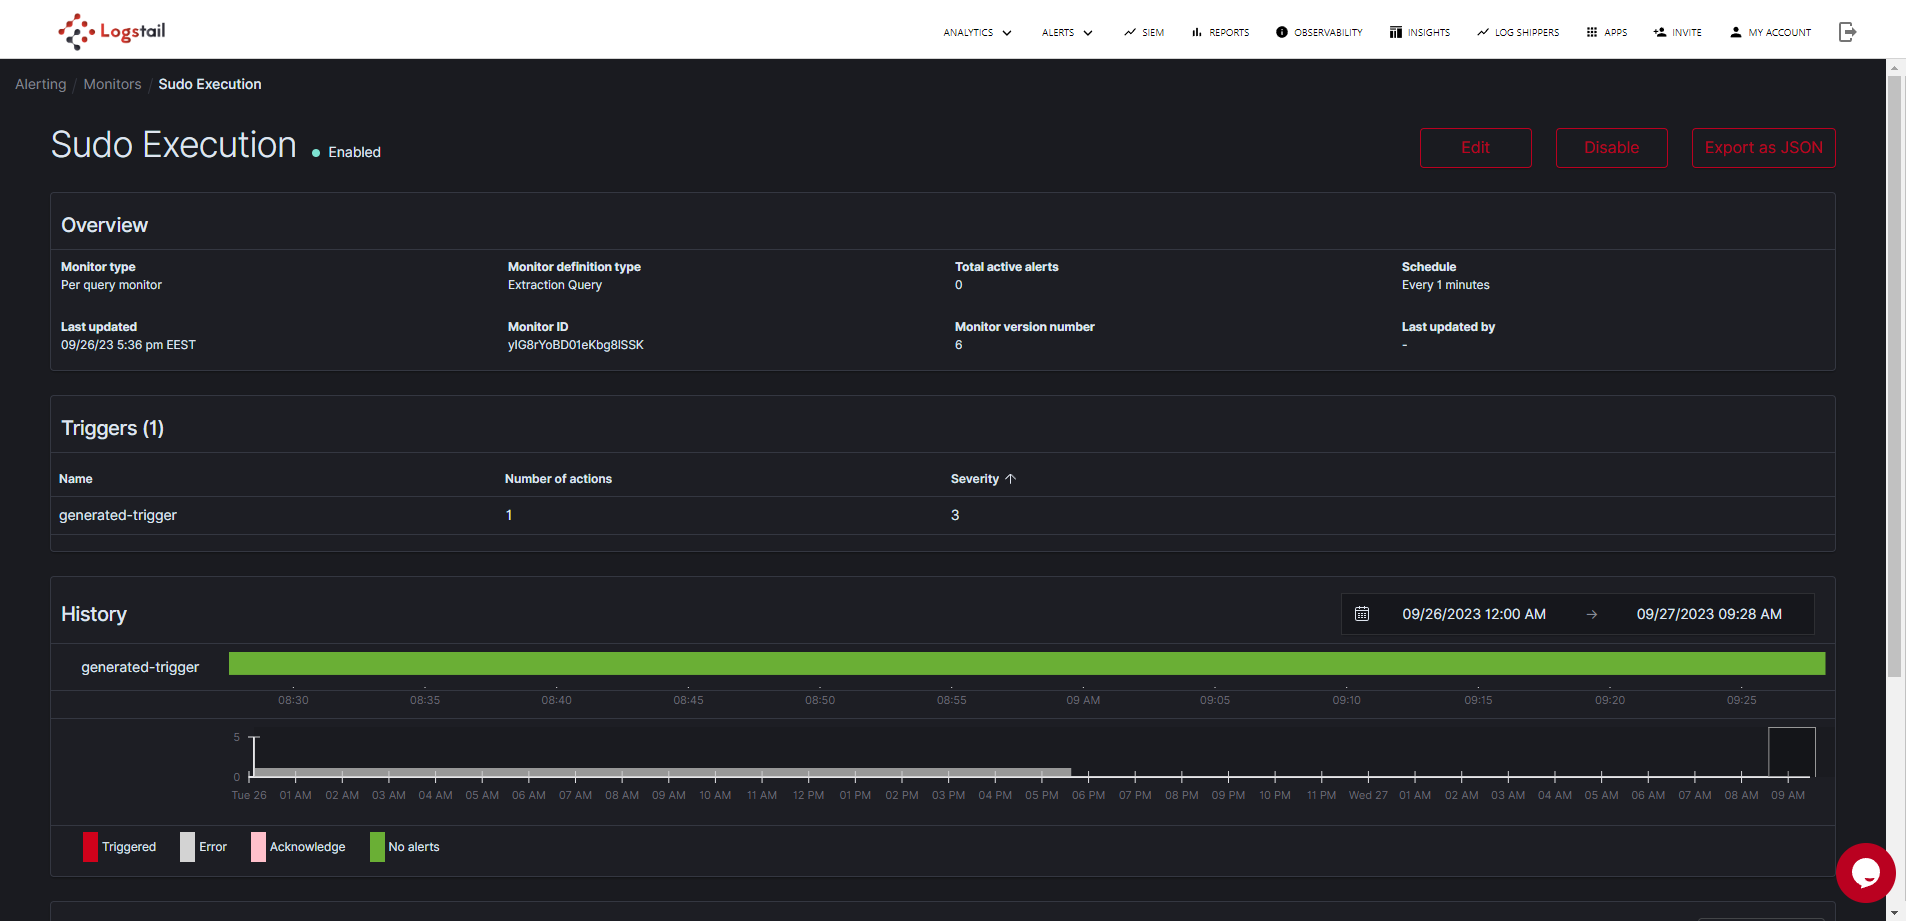
3) Triggers
Triggers are conditions that, when met, generate alerts and can perform some action.
4) Actions
Actions are the piece of information that you want the monitor to send out after being triggered. They have a destination, a message subject, and a message body.
5) Alerts
Alert is a notification that a monitor’s trigger condition has been met.
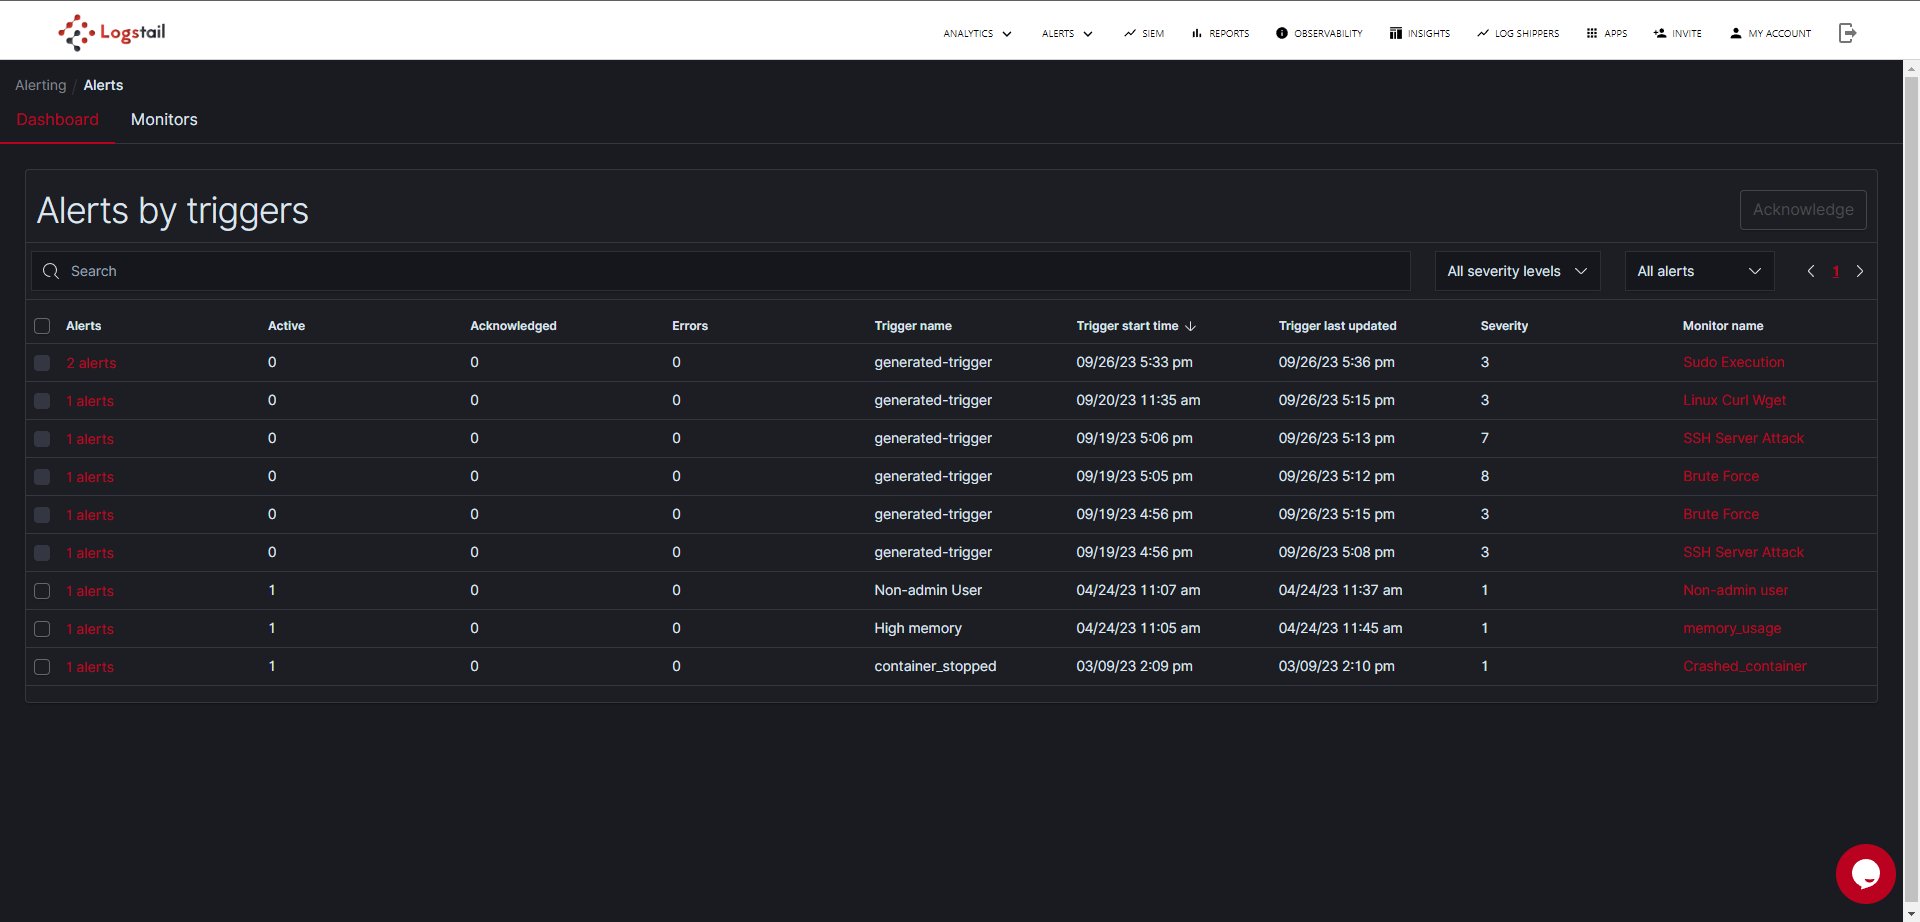
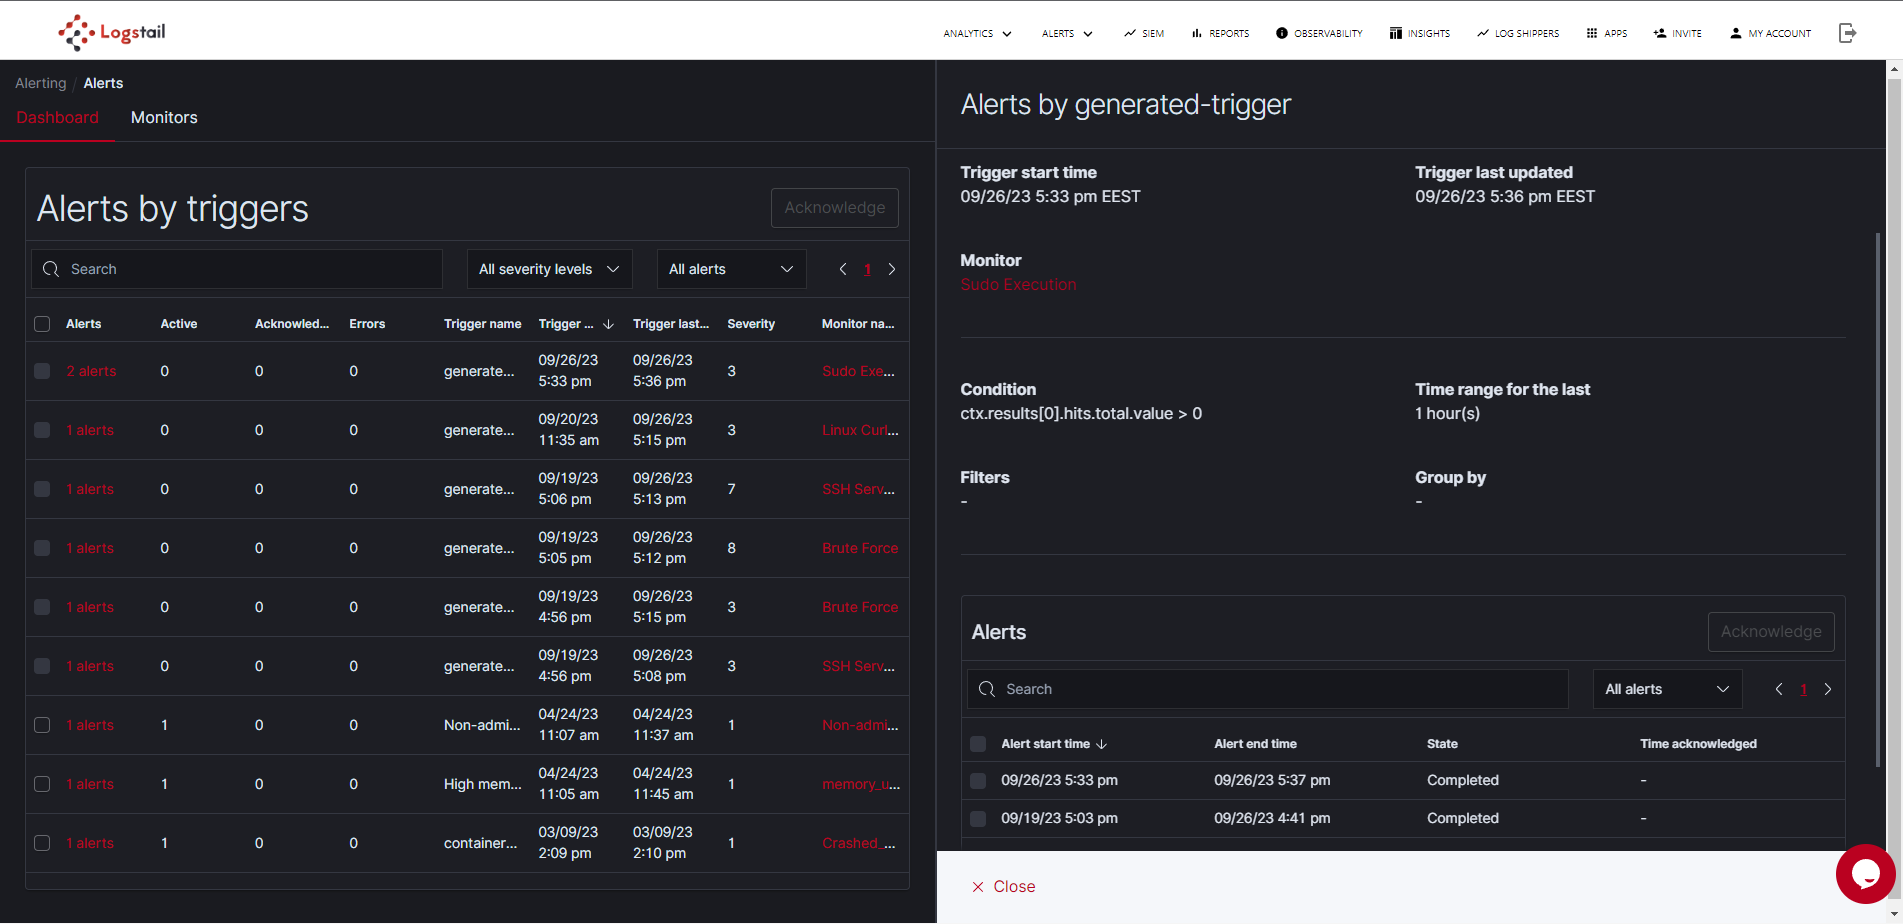
6) Dashboards
The dashboard gives you an overall picture of your alerting state.
How to create alerts
The general steps to create and manage alerts are shown in the image below.
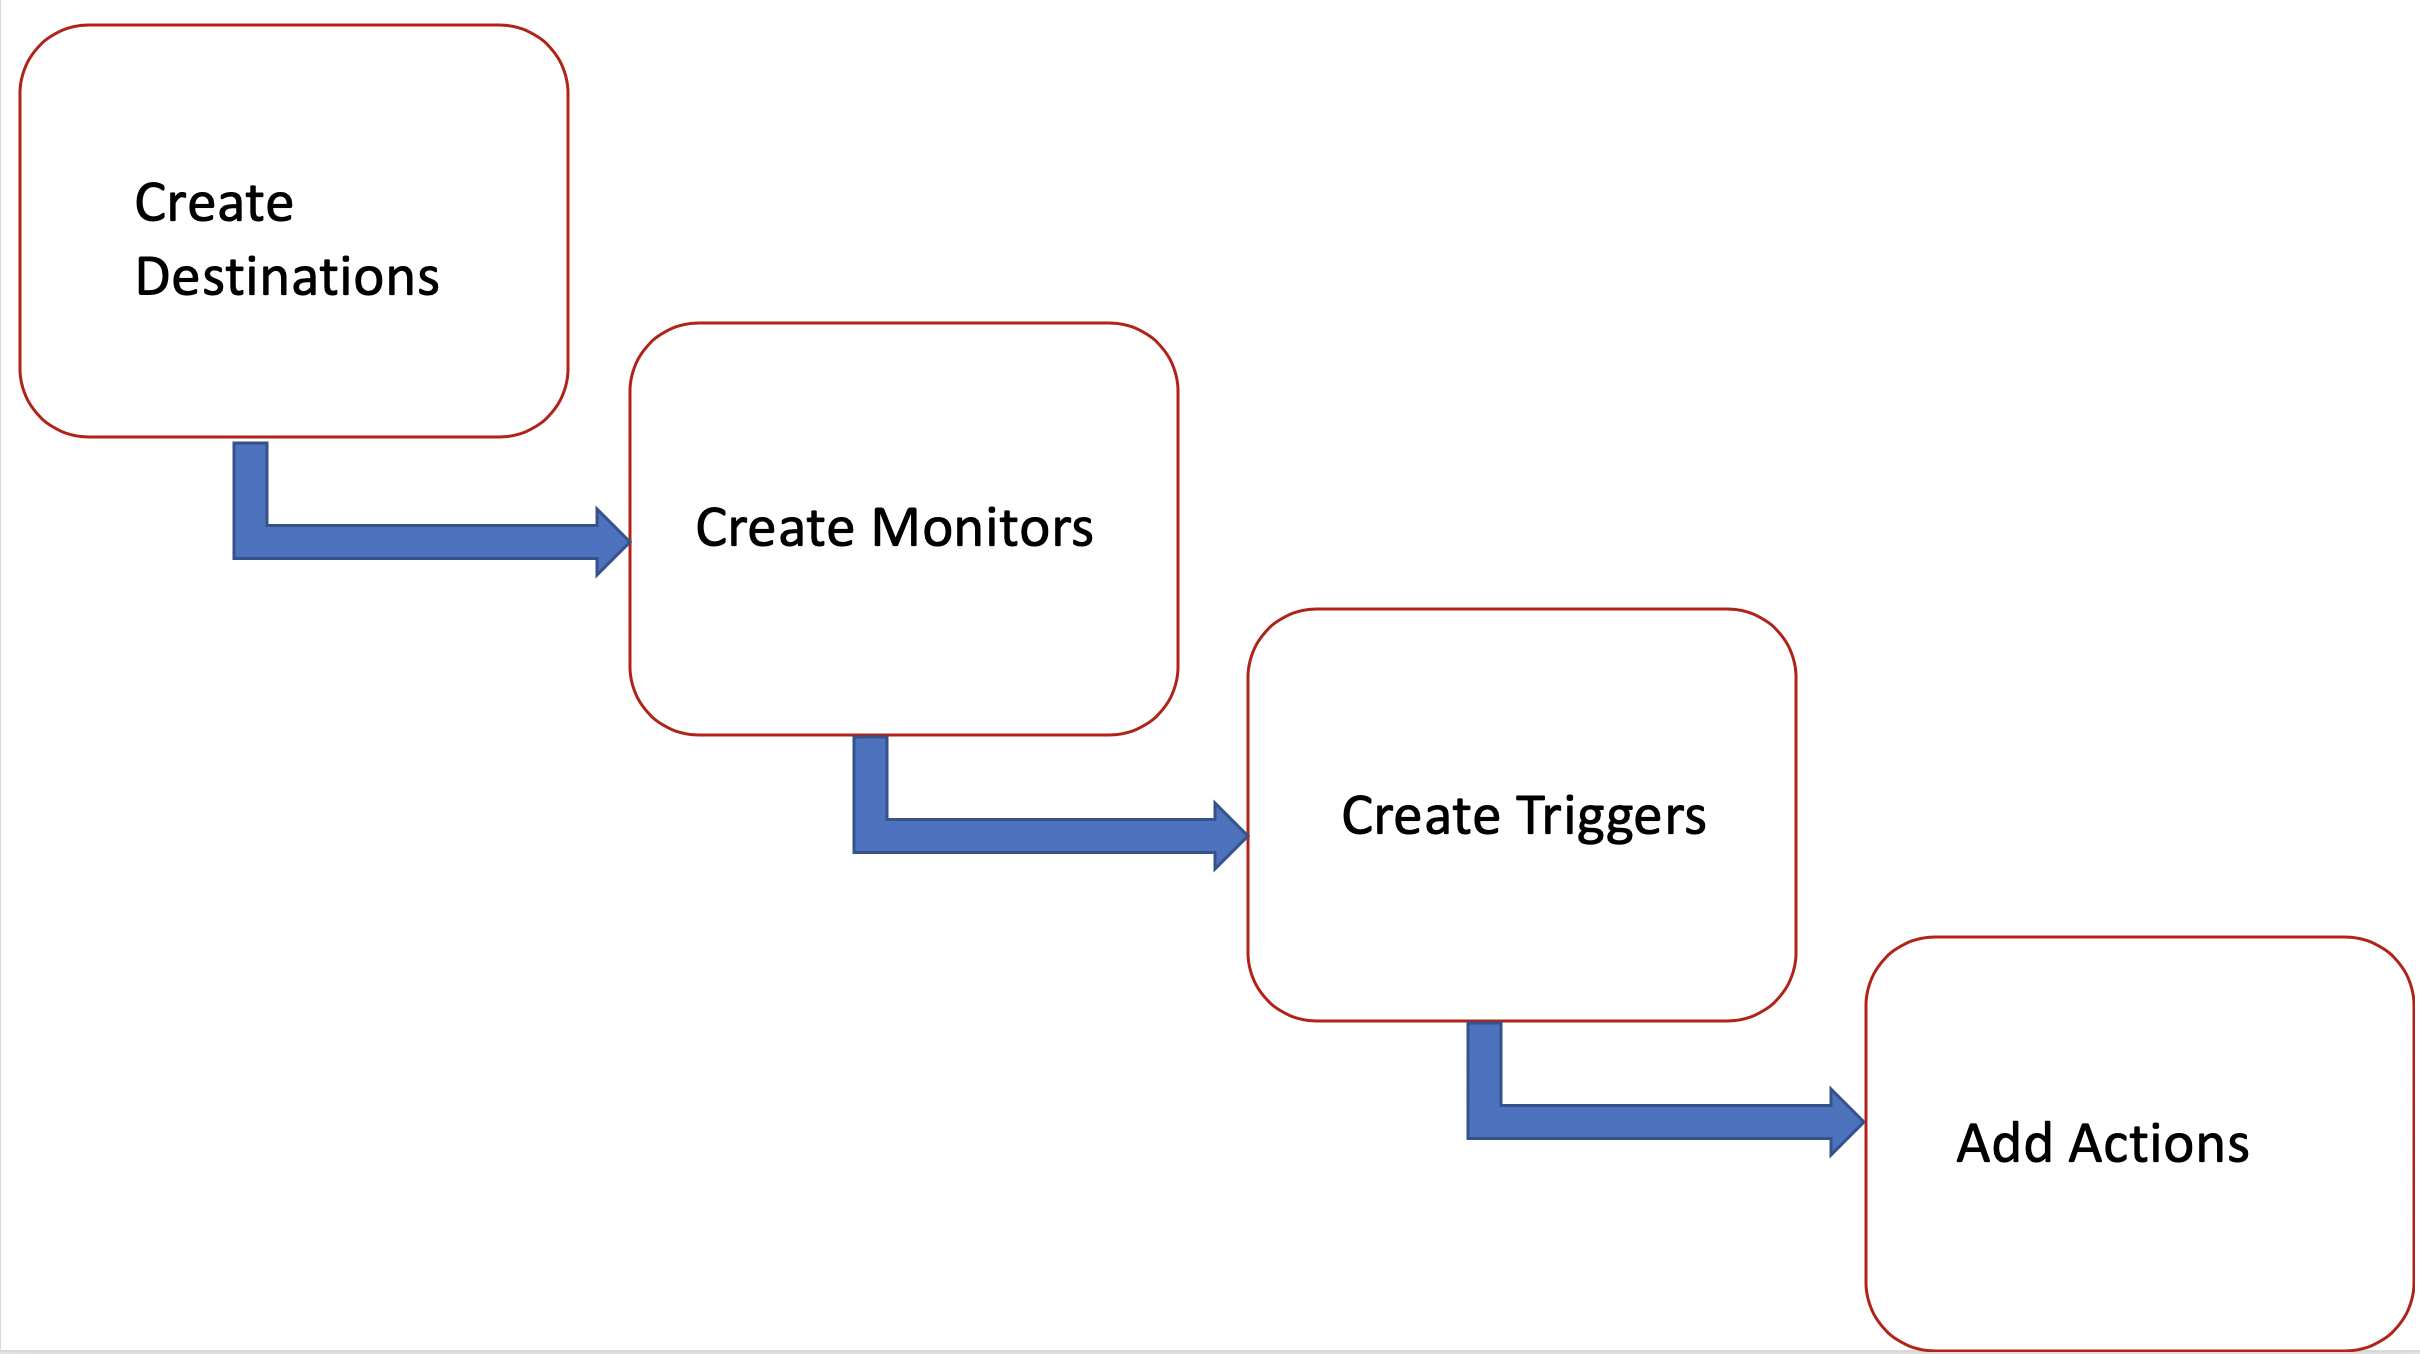
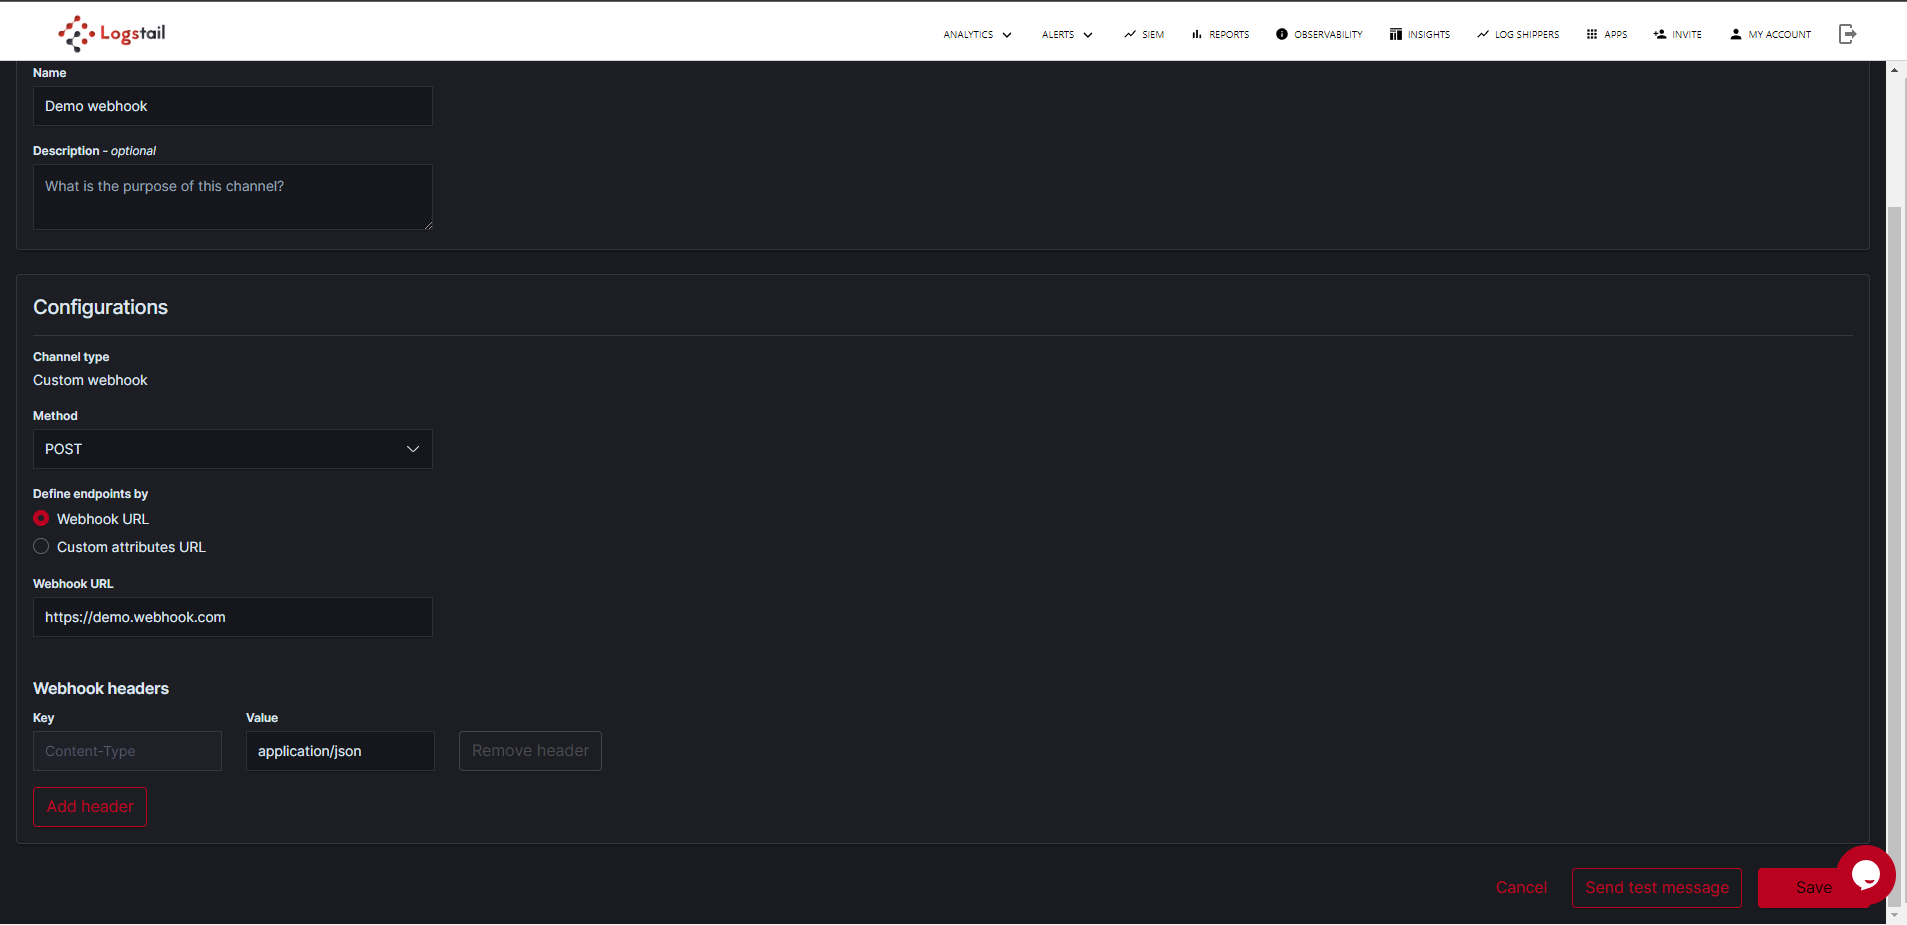
1) Create Destinations
The first step is to create a Destination. Choose Alerts → Alerting Channels → Create Channel. Specify a name for the destination so that you can identify it later. For type, choose Email, Slack, Amazon Chime, or custom webhook. Take note that these requests use the HTTP POST method.
For this use case, we will show how to create a webhook in Slack which seems to be extremely useful and many teams are utilizing it.
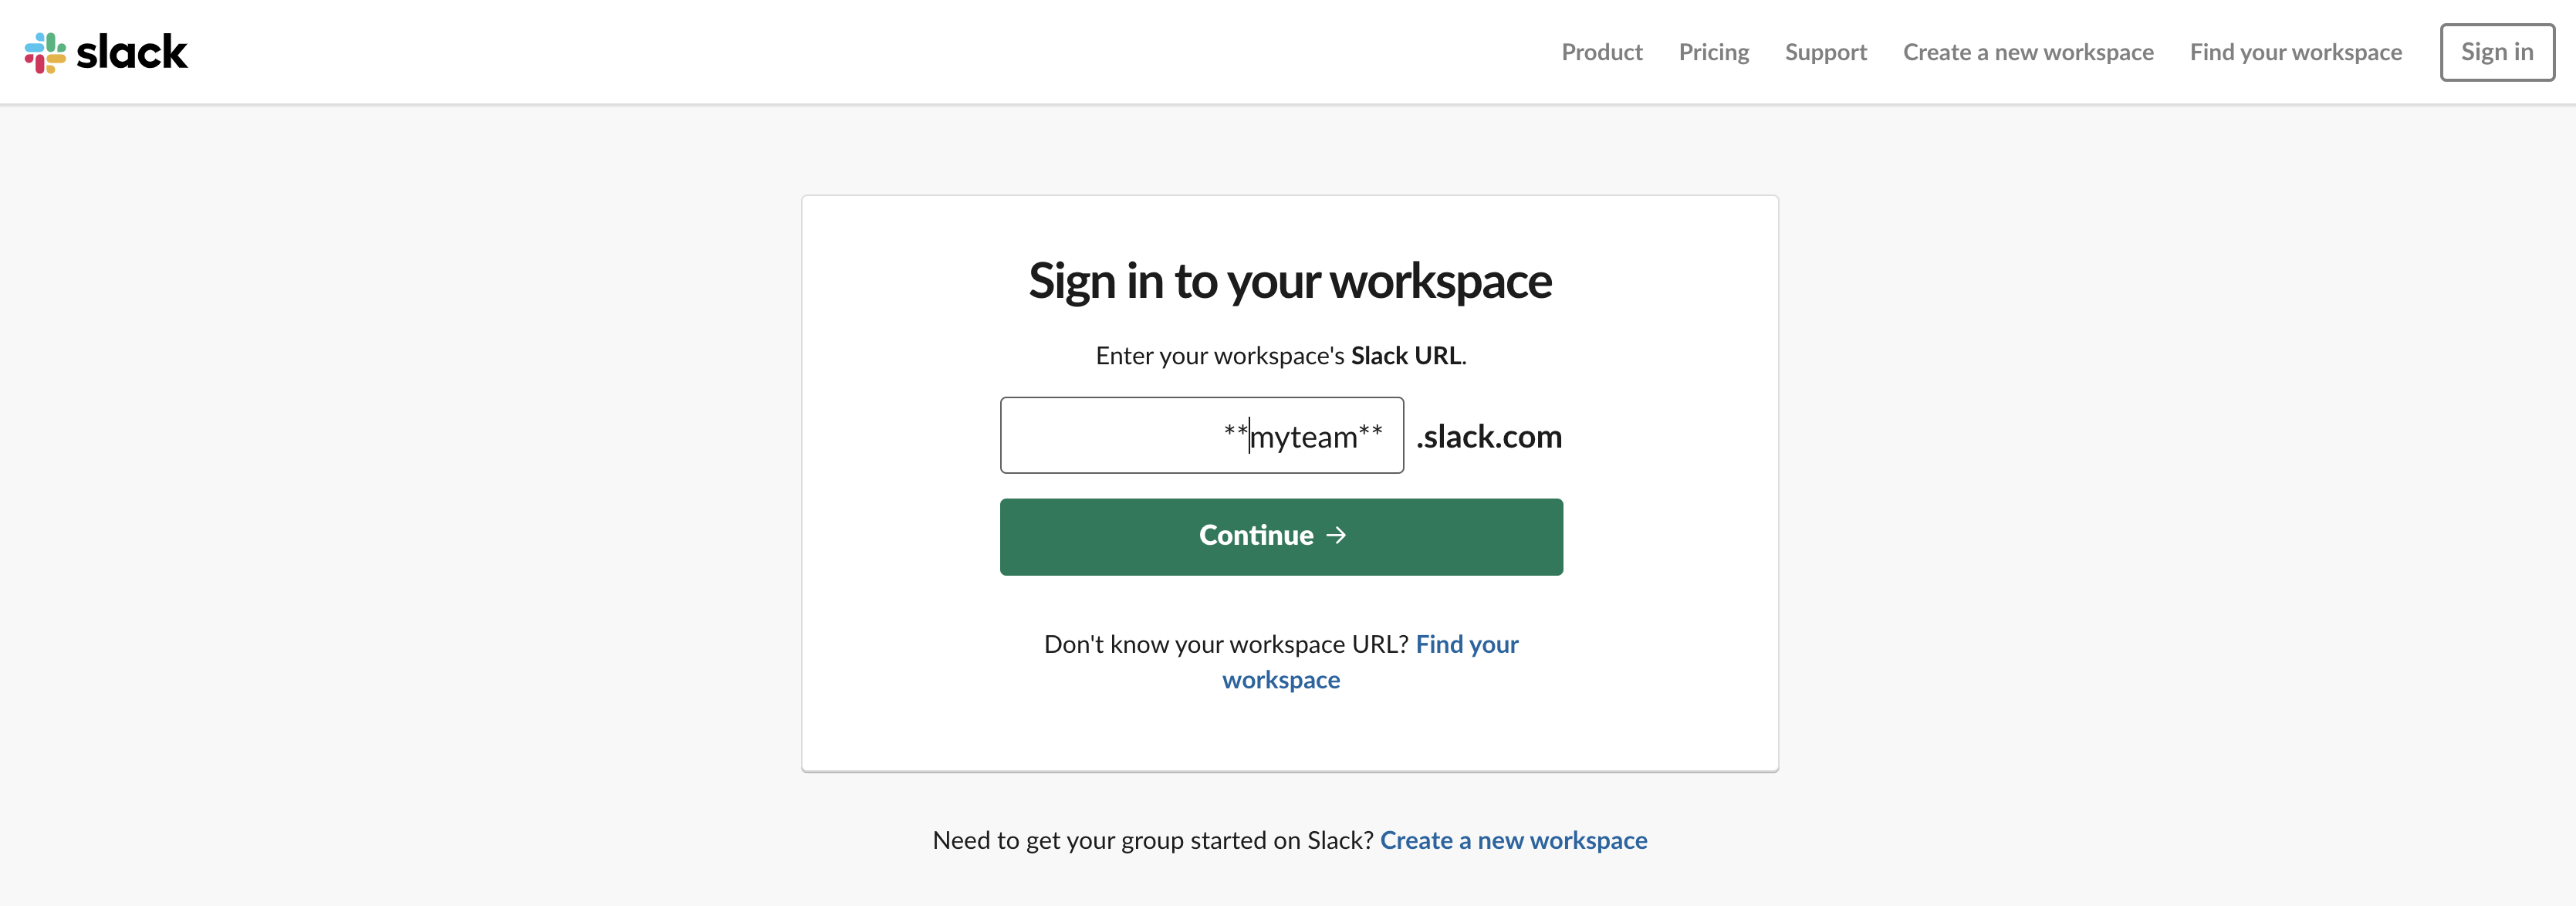
First of all, we must create an account in Slack and even better download the app for iOS or Android. First, sign in to your account.
Next step is to search for the term “Incoming webhooks”
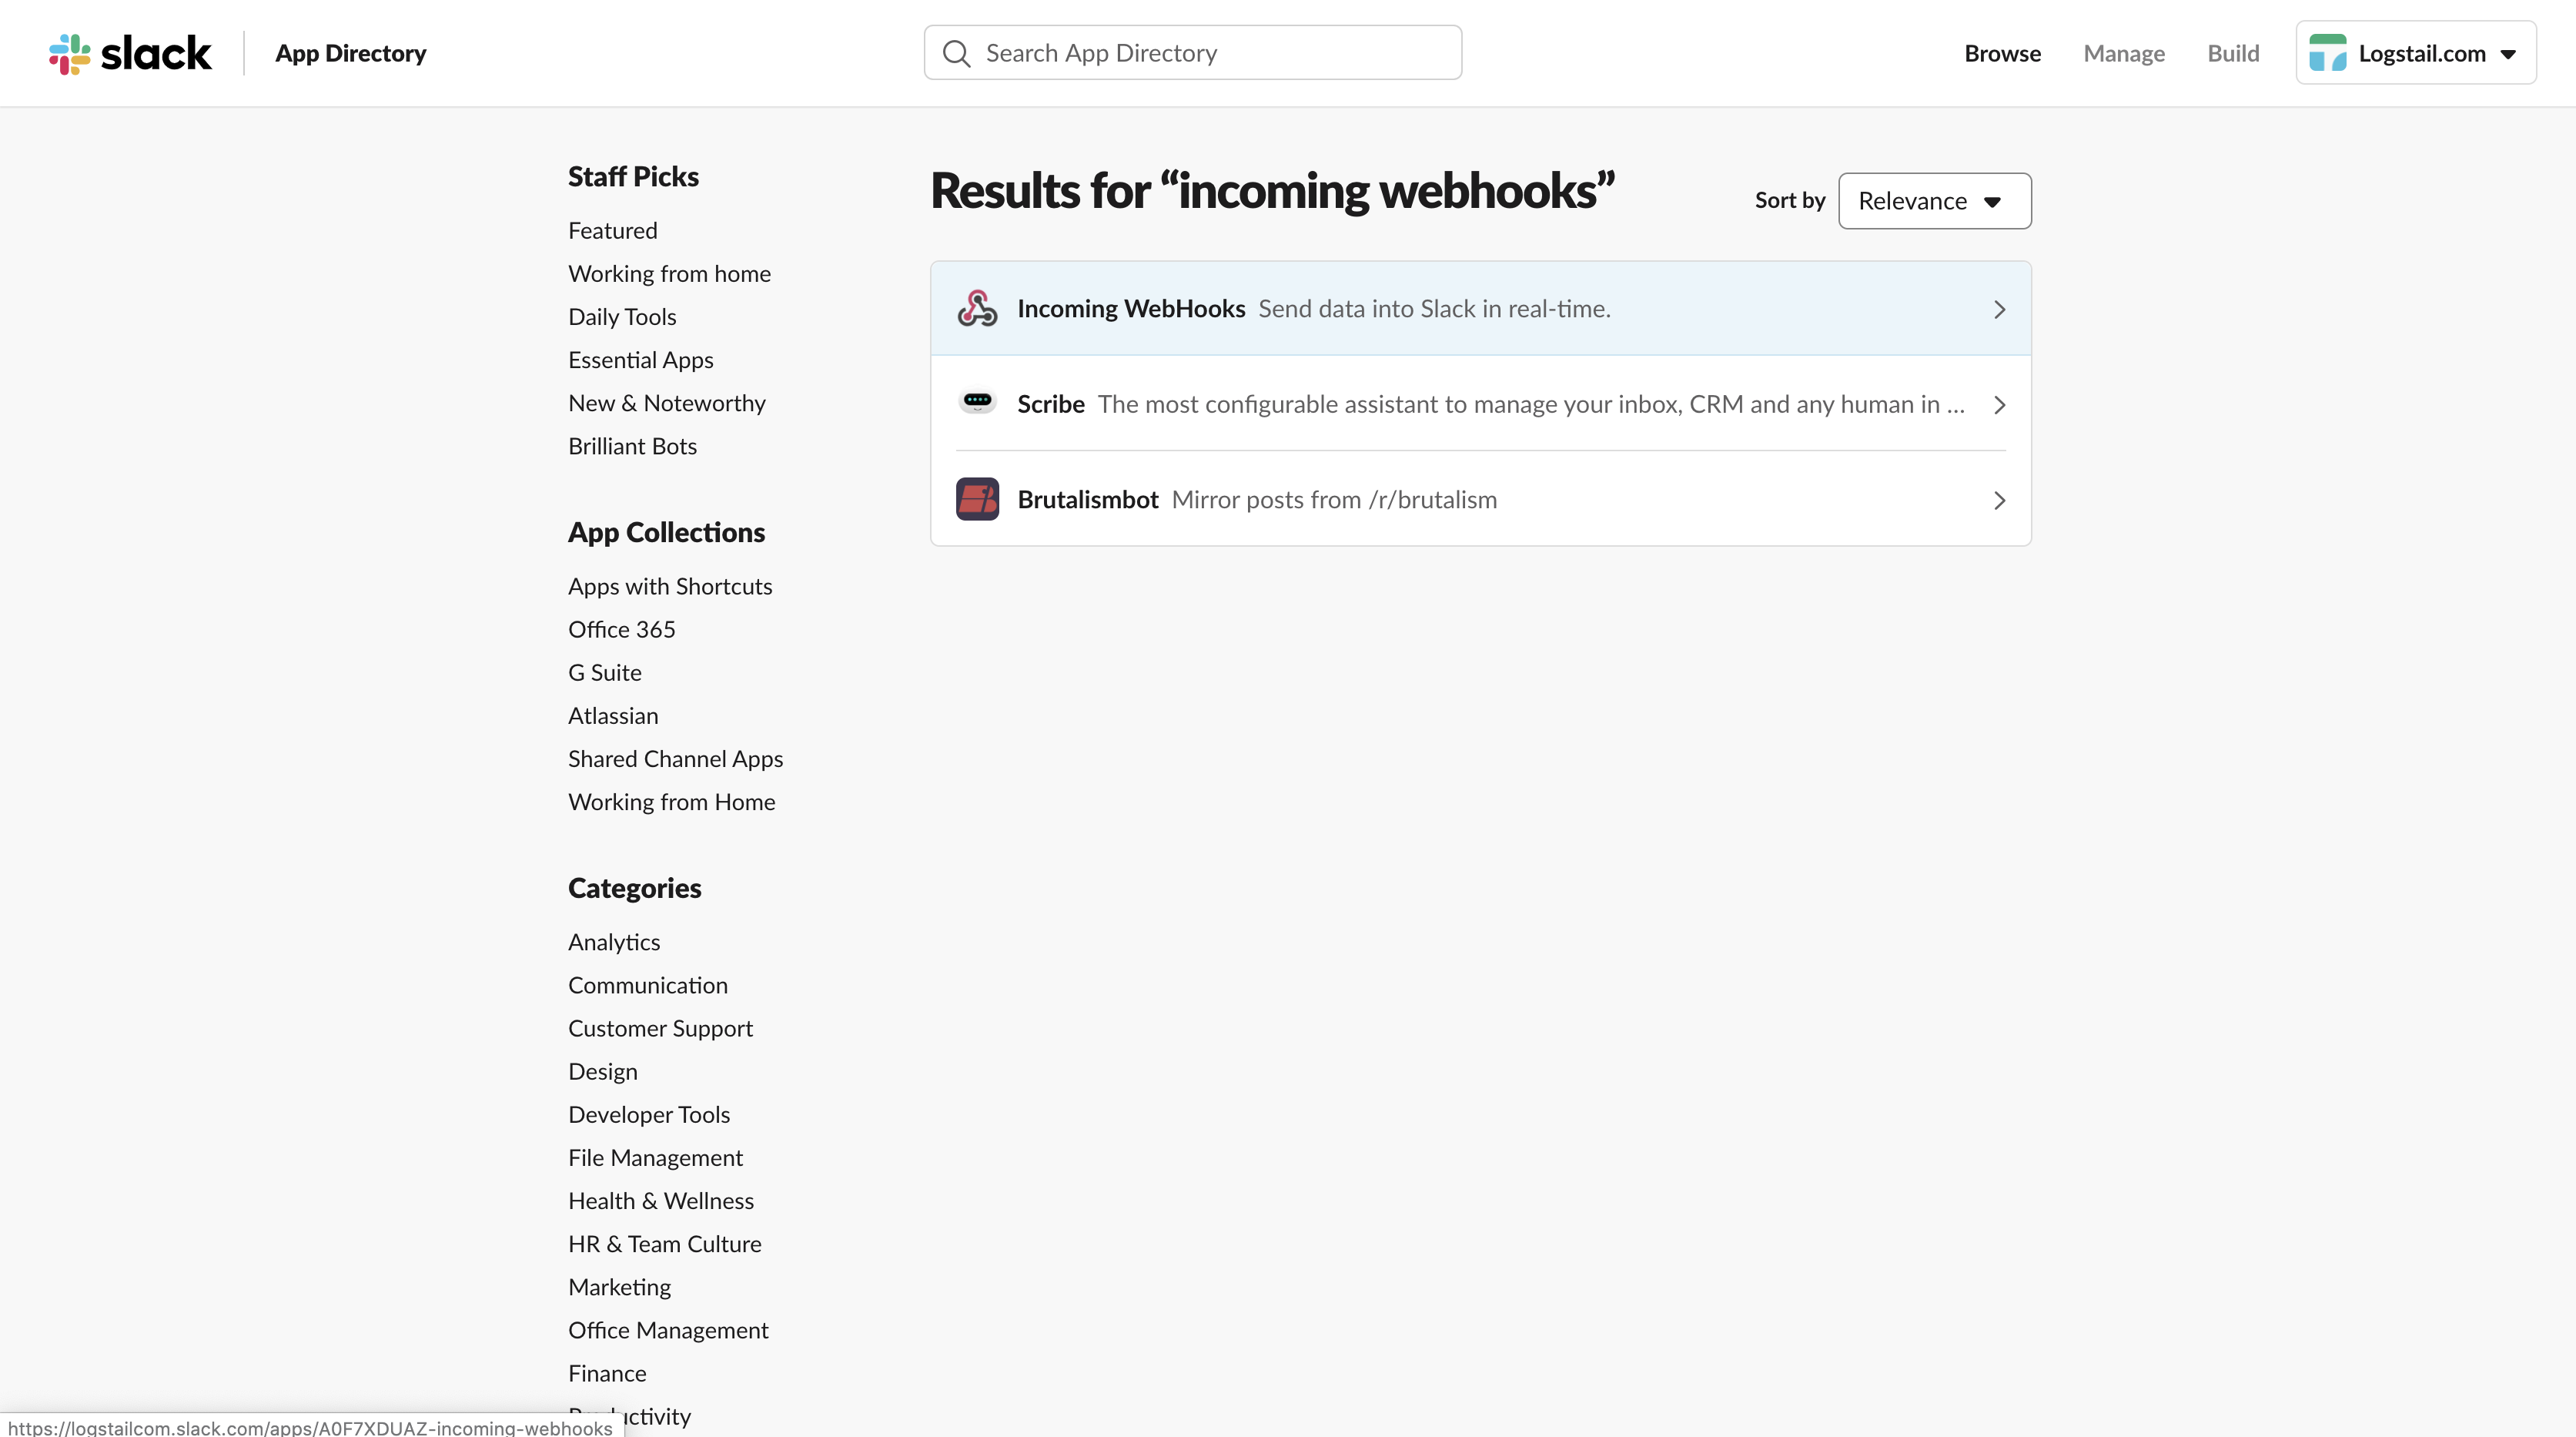
The first result that will be shown is the Incoming Webhooks Add-on
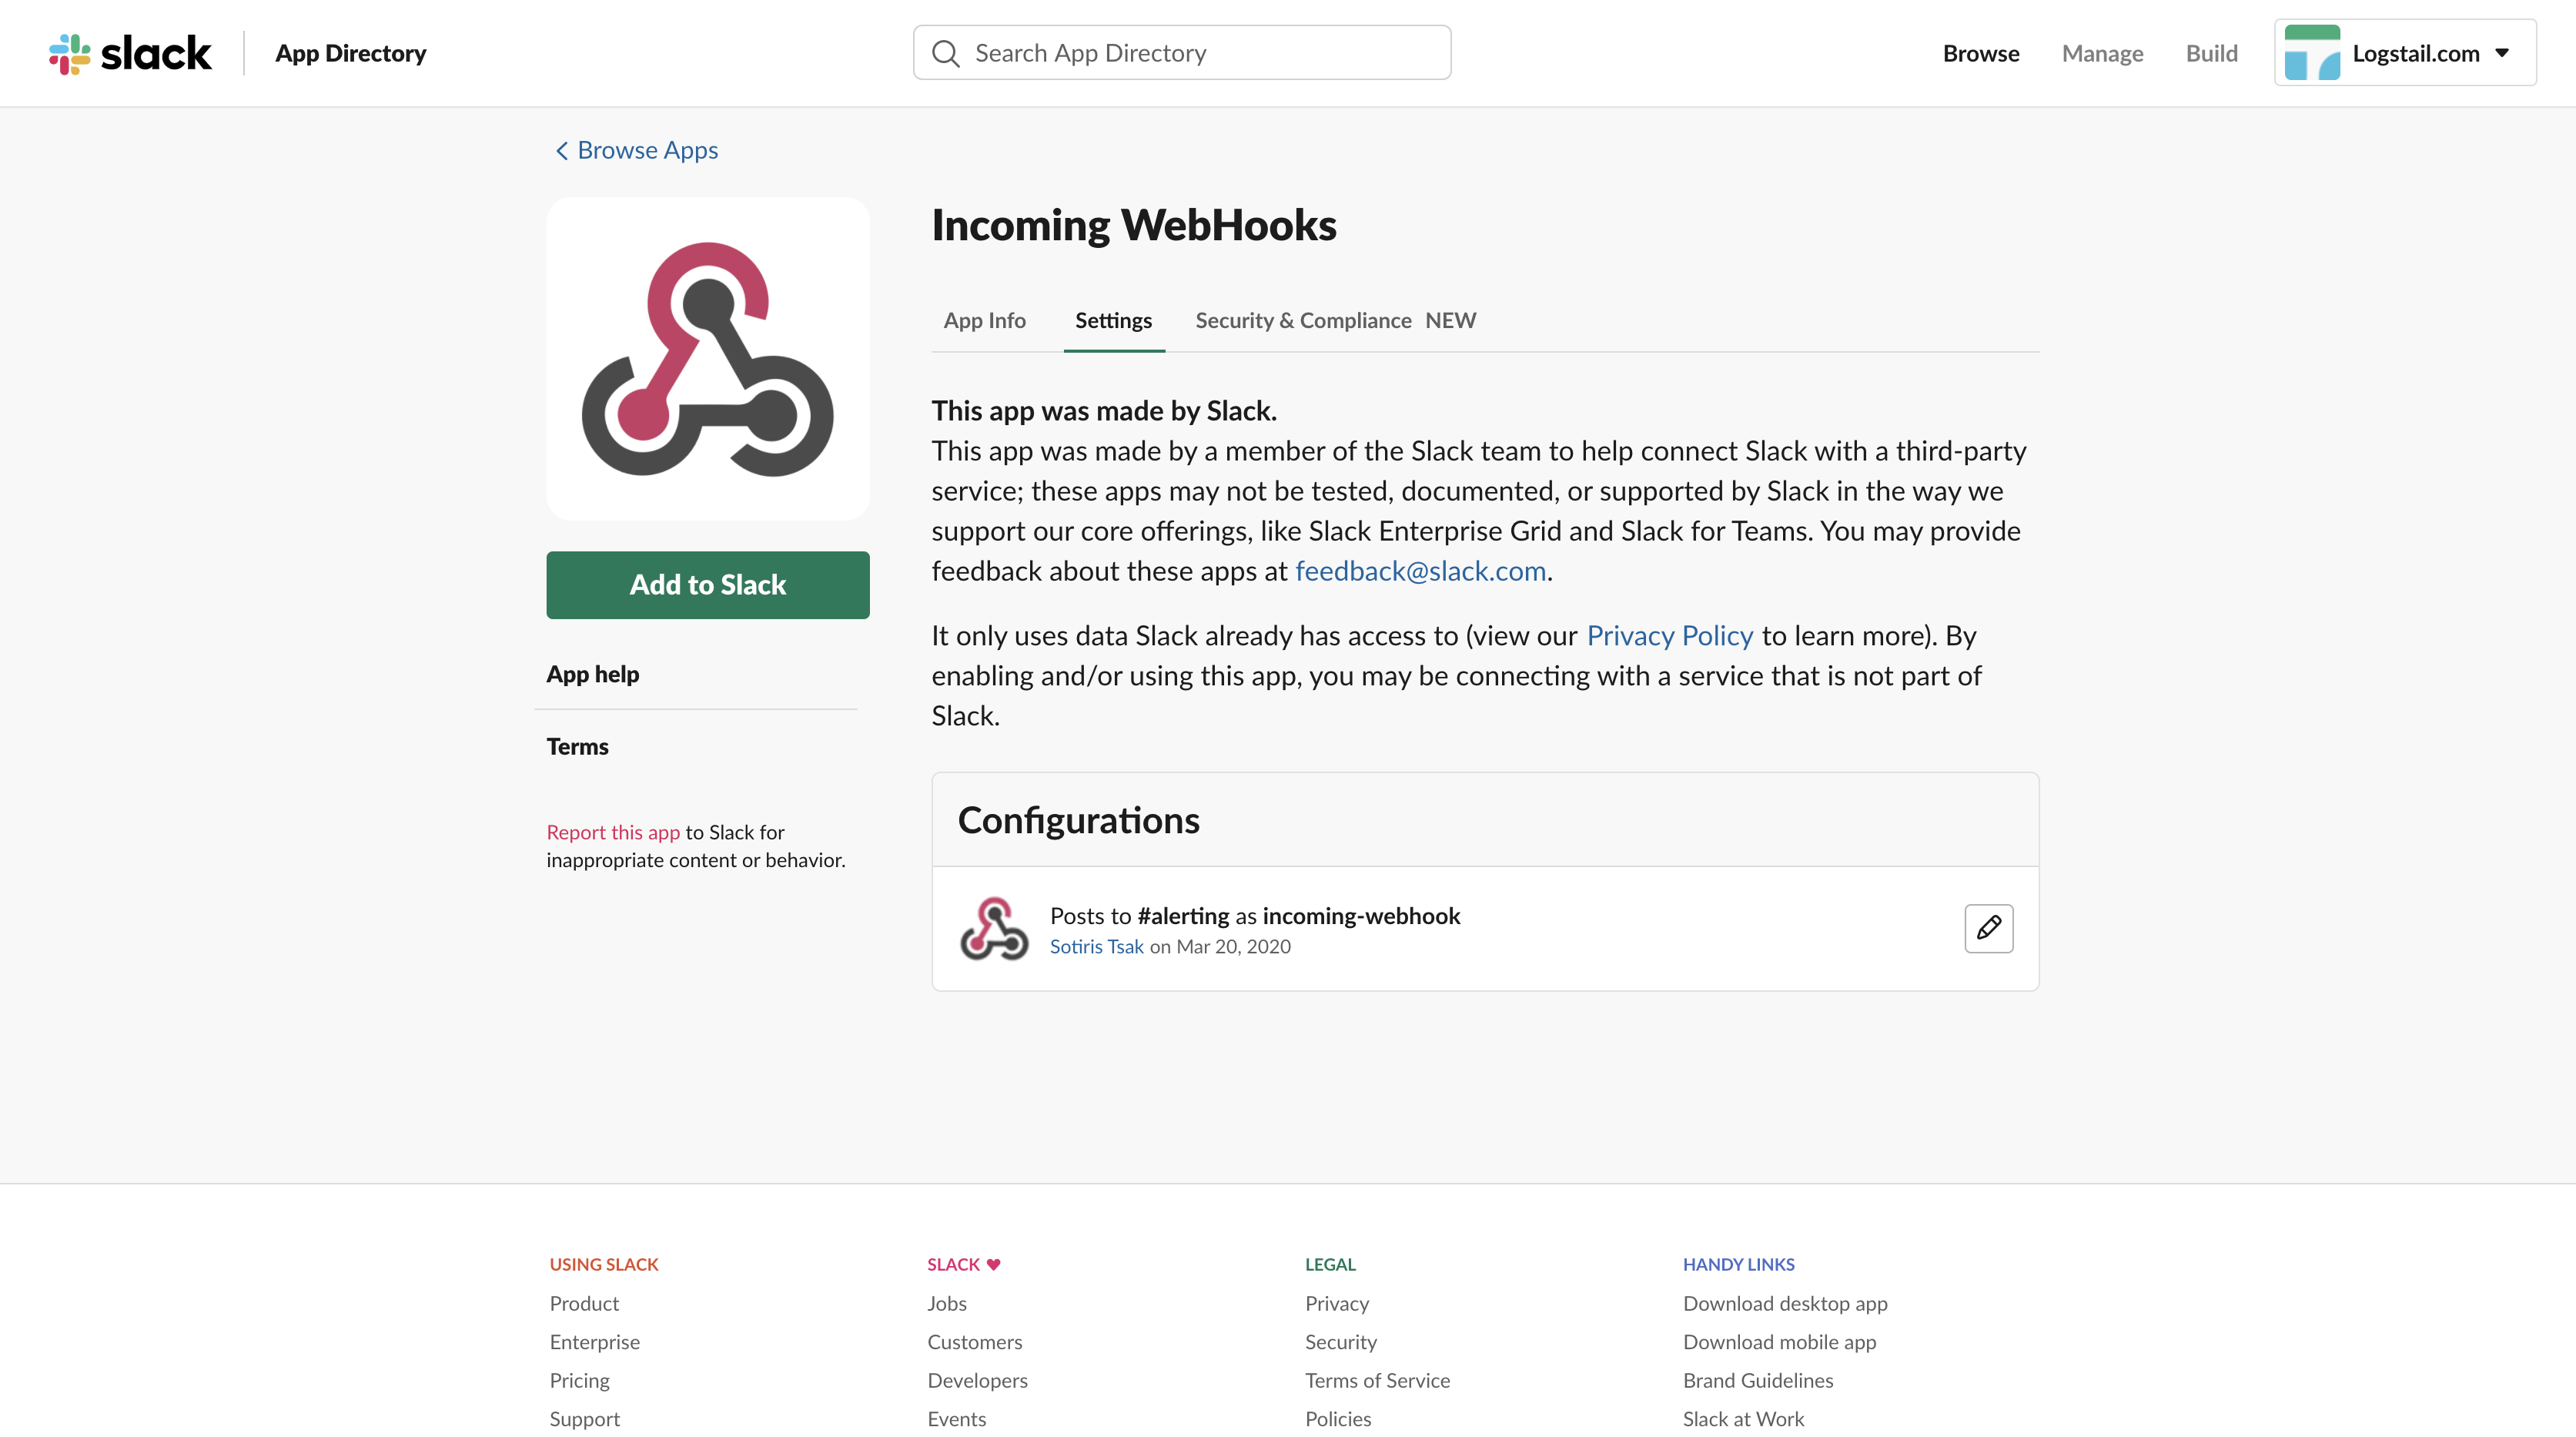
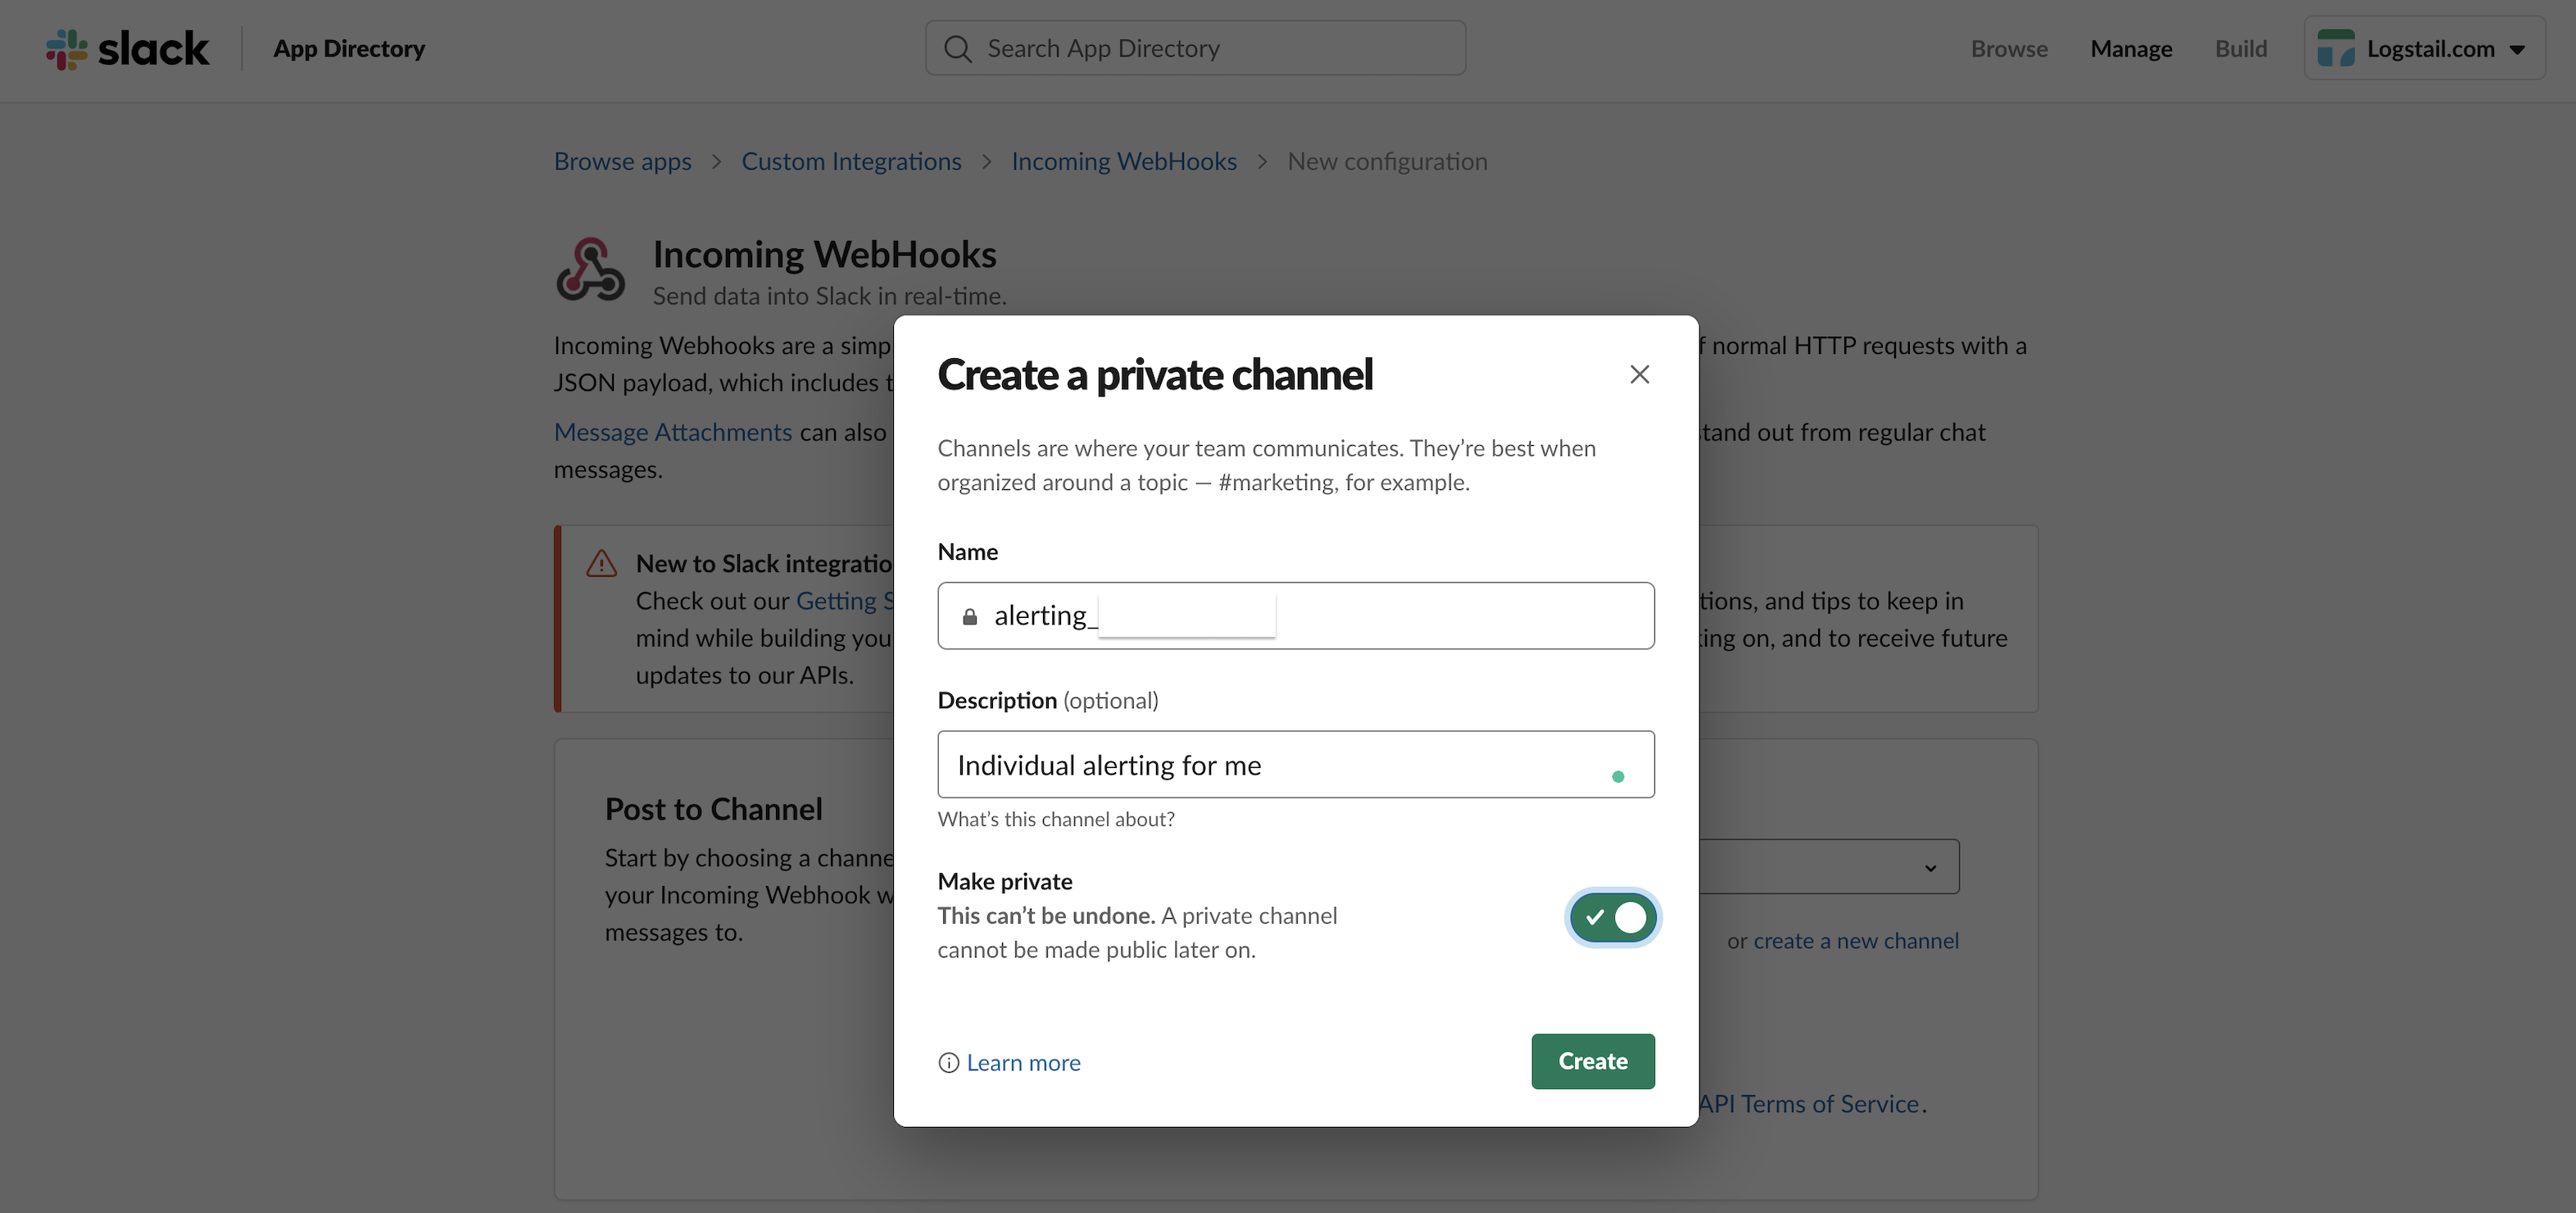
Press the button “Add to Slack” to add this functionality to your Slack and choose the channel you want the send the notification.

If you want, you can create a new channel that will be used only for notifications.
2) Create Monitors
The second step is to create a Monitor by choosing Alerts → Alerting Dashboards → Monitors →Create monitor.
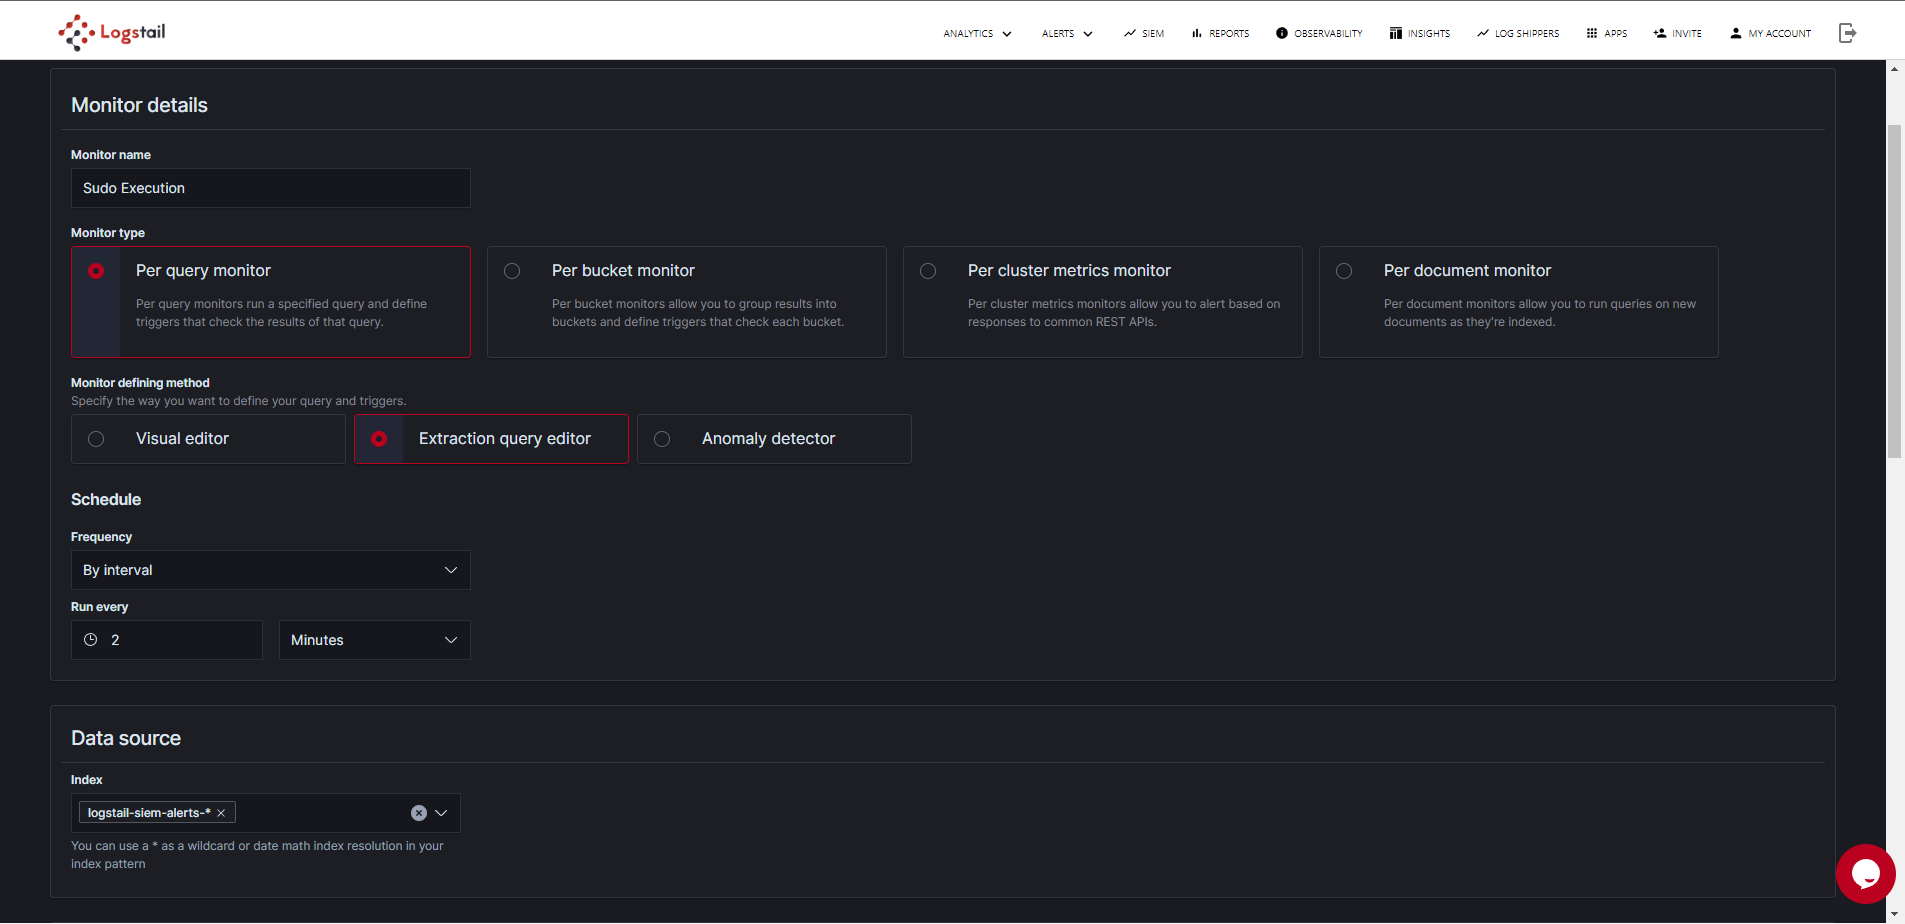
Specify a name ( in “Monitor name”) and schedule (how often do you want to run) for the monitor.
Choose one or more indices. You can also use * as a wildcard to specify an index pattern.
Define the monitor in one of three ways: visually, using a query, or using an anomaly detector.
- Visual editor definition works well for monitors that you can define as “some value is above or below some threshold for some amount of time”.To define a monitor visually, choose Define using visual editor. Then choose an aggregation, a set of documents, and a timeframe. Visual definition is the most common choice.
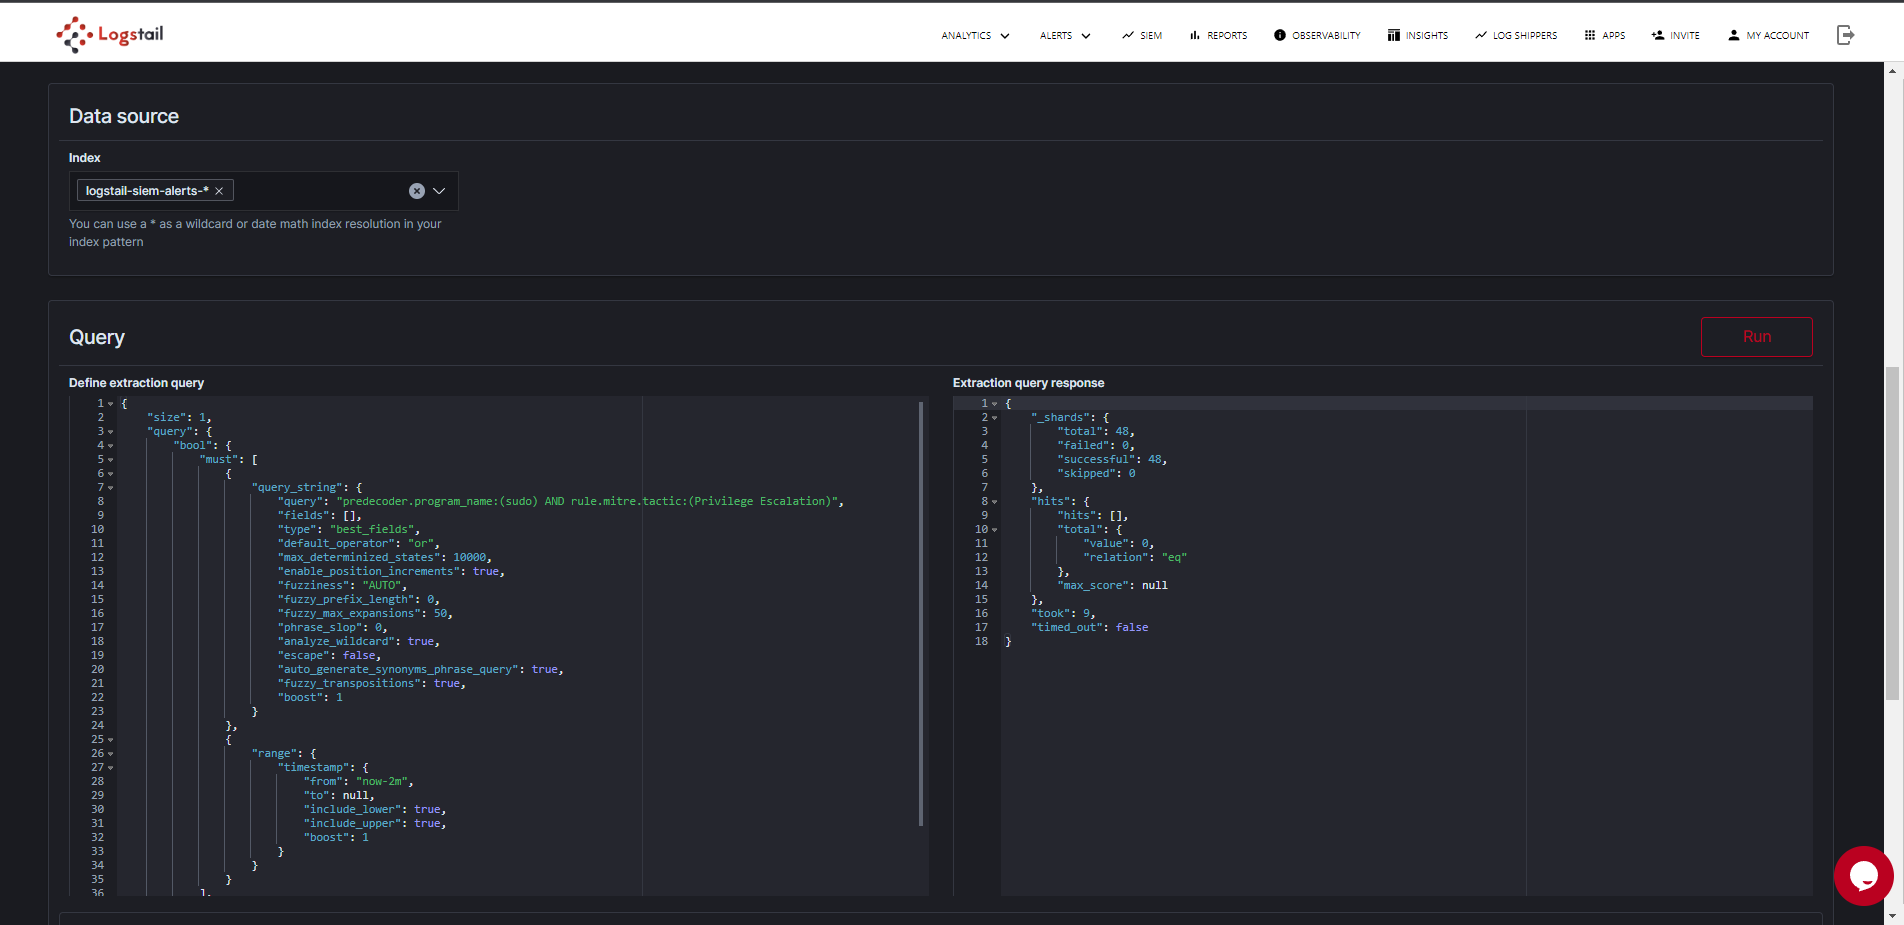
- Query definition gives you flexibility in terms of what you query for (using the Opensearch query language Lucene) and how you evaluate the results of that query (Painless scripting). To use a query, choose Define using extraction query, add your query (using the Opensearch query language Lucene), and test it using the Run button.
- To use an anomaly detector, choose Define using Anomaly detector and select your Detector.
Finally, choose Create.
IMPORTANT: Make sure the query time range is less or equal of the Alert Monitor time range. Misconfigurations might lead to excessive duplicate spam alerts!
3) Create Triggers
The third step is to create a trigger. These steps differ depending on whether you chose Define using visual graph, Define using extraction query or Define using Anomaly detector when you created the monitor.
Either way, you begin by specifying a name and severity level for the trigger which helps you to manage alerts. A trigger with a high severity level (e.g. 1) might inform a specific individual, whereas a trigger with a low severity level might message the whole team.
- Visual graph For Trigger condition, specify a threshold for the aggregation and timeframe you chose earlier, such as “is below 1,200” or “is exactly 1200.” The line moves up and down as you increase and decrease the threshold. Once this line is crossed, the trigger evaluates to true.
- Extraction query For Trigger condition, specify a script that returns true or false. A return value of true means the trigger condition has been met, and the trigger should execute its actions. Test your script using the Run button.
- Anomaly detector For Trigger type, choose Anomaly detector grade and confidence. Specify the Anomaly grade condition for the aggregation and timeframe you chose earlier, “IS ABOVE 0.8” or “IS EXACTLY 0.6.” The anomaly grade is a number between 0 and 1 that indicates the level of severity of how anomalous a data point is. Specify the Anomaly confidence condition for the aggregation and timeframe you chose earlier, “IS ABOVE 0.8” or “IS EXACTLY 0.6.” The anomaly confidence is an estimate of the probability that the reported anomaly grade matches the expected anomaly grade. The line moves up and down as you increase and decrease the threshold. Once this line is crossed, the trigger evaluates to true.
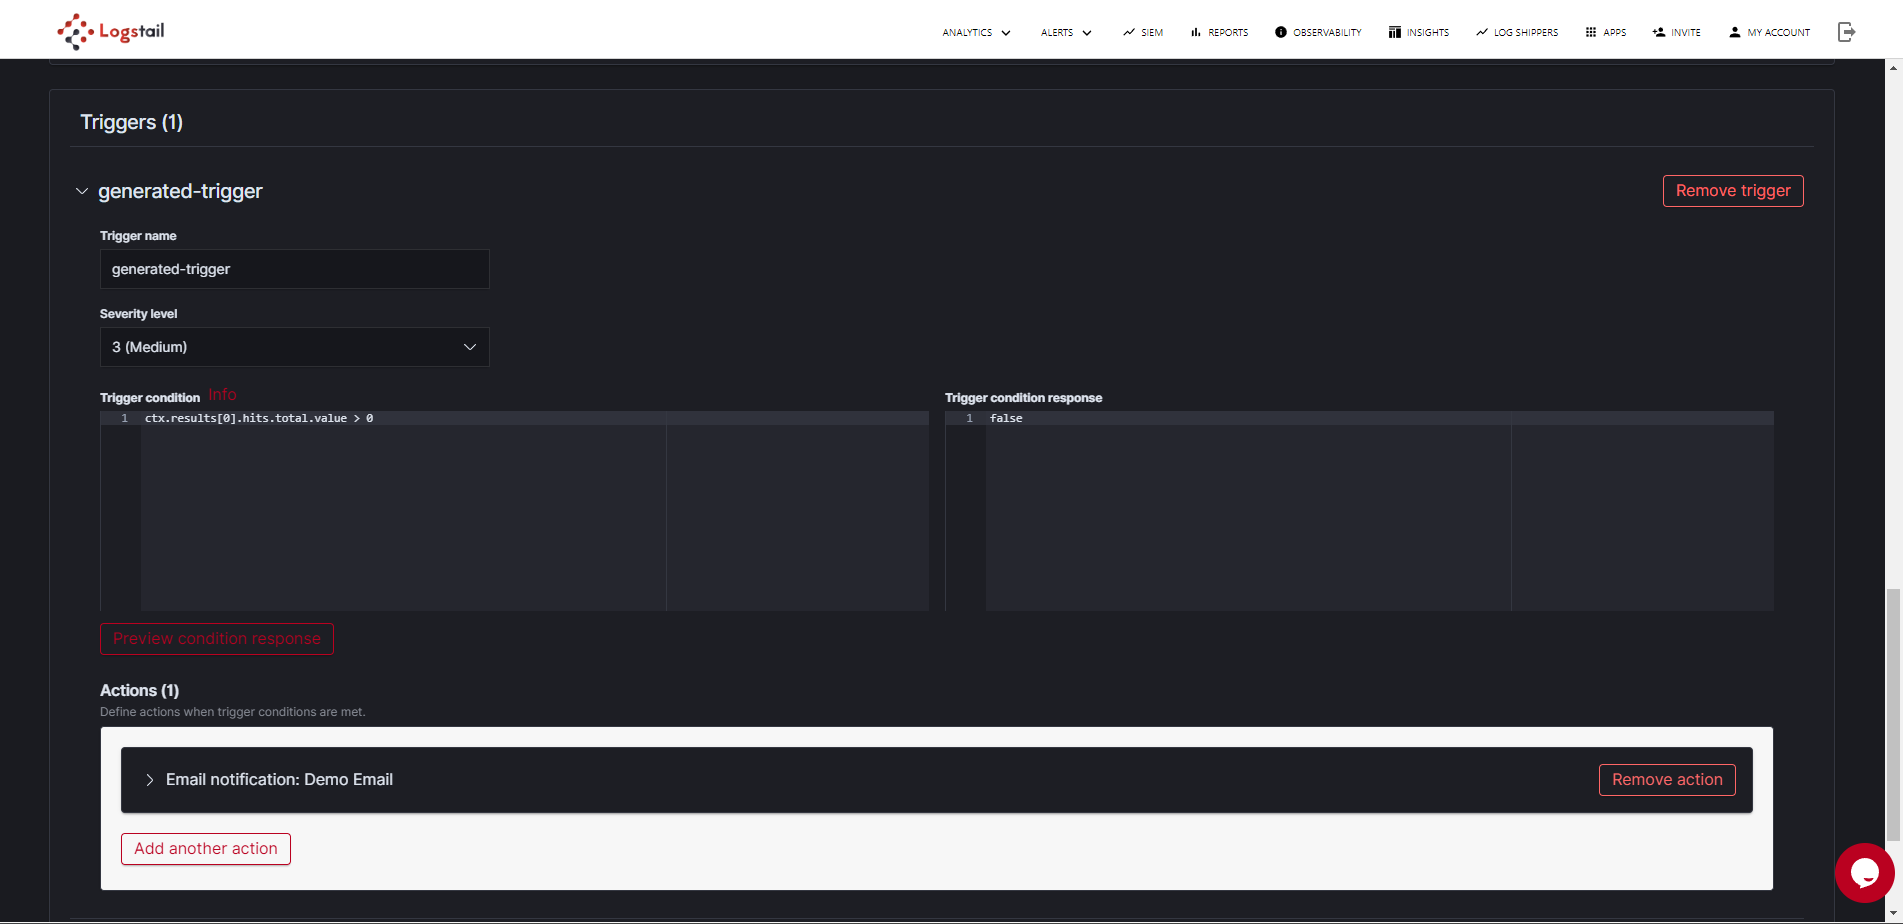
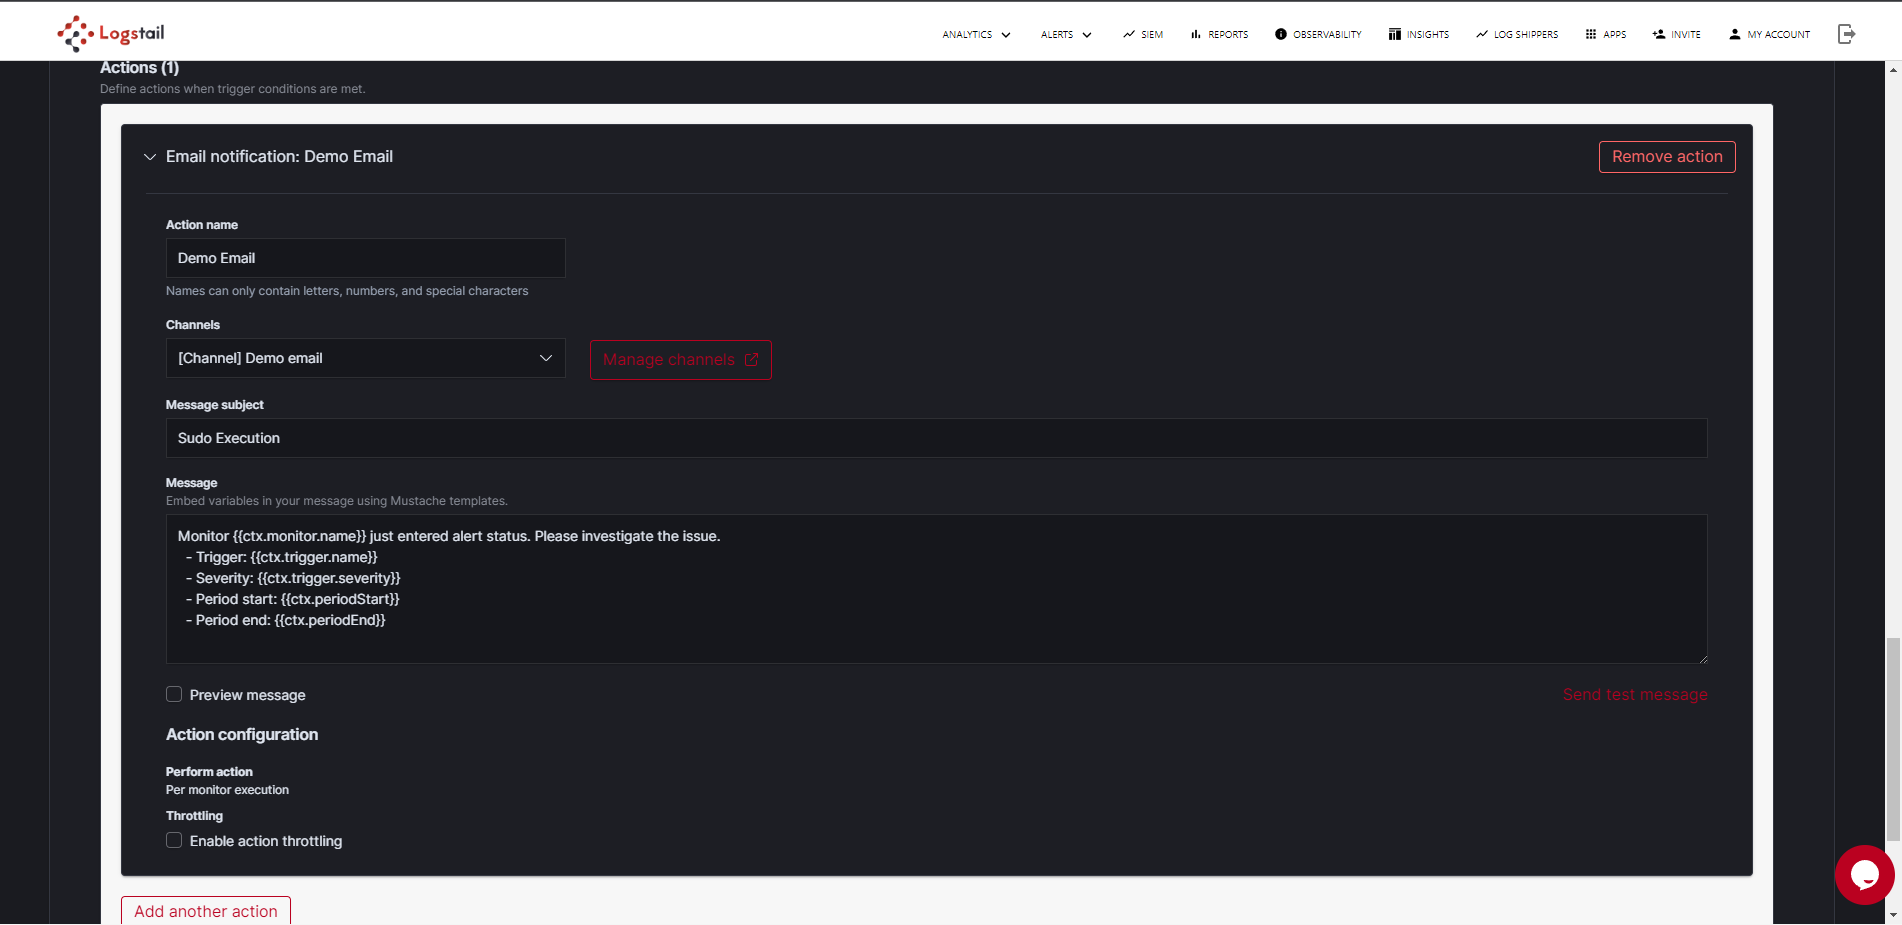
4) Add Actions
The final step is to create an action. Actions send notifications when trigger conditions are met and support Slack, Amazon Chime, and webhooks. If you don’t want to receive notifications for alerts, you don’t have to add actions to your triggers. Instead, you can periodically check Kibana.
Specify a name for the action and choose a destination.
Add a subject and body for the message. You can add variables to your messages using Mustache templates. You can send a test message to verify that everything is according to your settings.
Finally, choose Create.
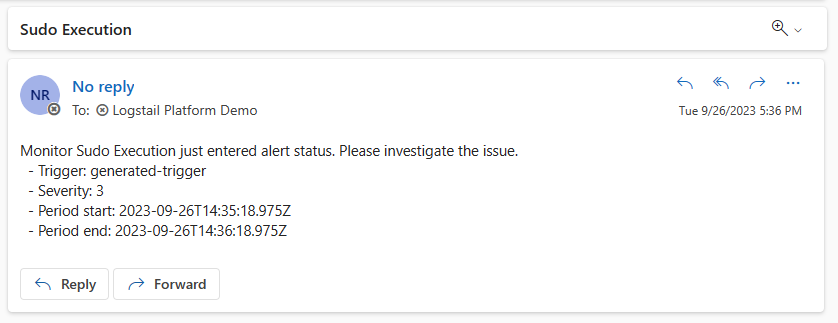
When you complete the above steps and the conditions for the alert are met, you will be notified with a message like this on Slack or Email:

Conclusion
In conclusion, Logstail’s Alerting feature is a powerful tool that enhances the monitoring and management of log data for organizations of all sizes. With the ability to create custom alerts based on specific log events or patterns, Logstail empowers users to proactively respond to critical incidents and anomalies in their systems and applications.
The Alerting feature not only provides real-time notifications but also supports various notification channels, ensuring that the right people are informed promptly. This flexibility enables teams to take swift action to address issues, minimize downtime, and maintain the integrity and performance of their infrastructure.