April 10, 2023
Endpoint Network Monitoring with Logstail
Network Monitoring: Ensuring Performance, Security, and Compliance.
Nowadays, monitoring the IT networks, has become a crucial task for IT, Sec and OPS teams. With so many devices and applications connected to networks, it’s essential to keep track of network performance, security, and compliance. Network monitoring involves the constant monitoring and analysis of network traffic to identify issues, track performance metrics, and ensure that the network is operating as intended. In this blog post, we will explore the importance of network monitoring, the benefits it provides, how to setup network monitoring in Logstail, and we will explain some key visualizations.
Importance of Network Monitoring
Effective network monitoring is crucial for ensuring that your network is performing optimally, maintaining security, and meeting compliance requirements. With the increasing complexity of networks, it can be difficult to identify potential issues before they cause significant problems. Network monitoring helps to detect and resolve issues quickly, minimizing the impact on users and the organization as a whole. It also provides valuable insights into network usage and performance, which can help to identify areas for optimization and improvement.
Benefits of Network Monitoring
The benefits of network monitoring are numerous. By monitoring your network, you can proactively identify and address potential issues before they cause significant problems, minimizing downtime and maximizing network uptime. You can also gain valuable insights into network usage patterns, which can help you to optimize network performance and improve user experiences. Additionally, network monitoring can help you to maintain compliance with industry and regulatory requirements, ensuring that your network is secure and compliant with relevant standards.
Analyze your Network with Logstail
Before starting up you need to have a Logstail account. If you don’t have one you can register here for free.
- After, navigate to Log Shippers page and find the packetbeat Setup guide .
- Choose your Operating System and follow the detailed instructions to download and setup the packetbeat.
- Make any necessary changed based on your needs (Modify ports to listen to).
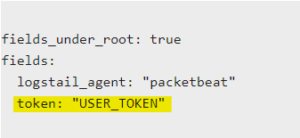
- Do not forget to replace your token
- Restart the packetbeat and you are set to go.
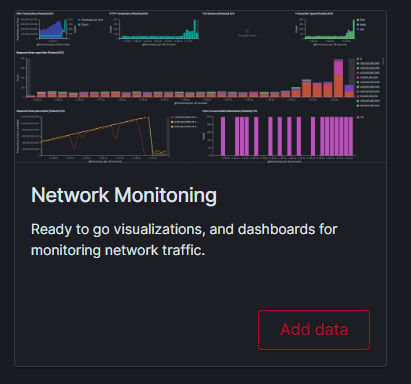
- Next step, navigate to Apps tab and install the Network Monitoring dashboard.
Discover feature
Now that you have setup packetbeat and installed the Network Monitoring dashboard you can navigate in the Discover page where you will see the collected data getting analyzed and shipped in your stack.
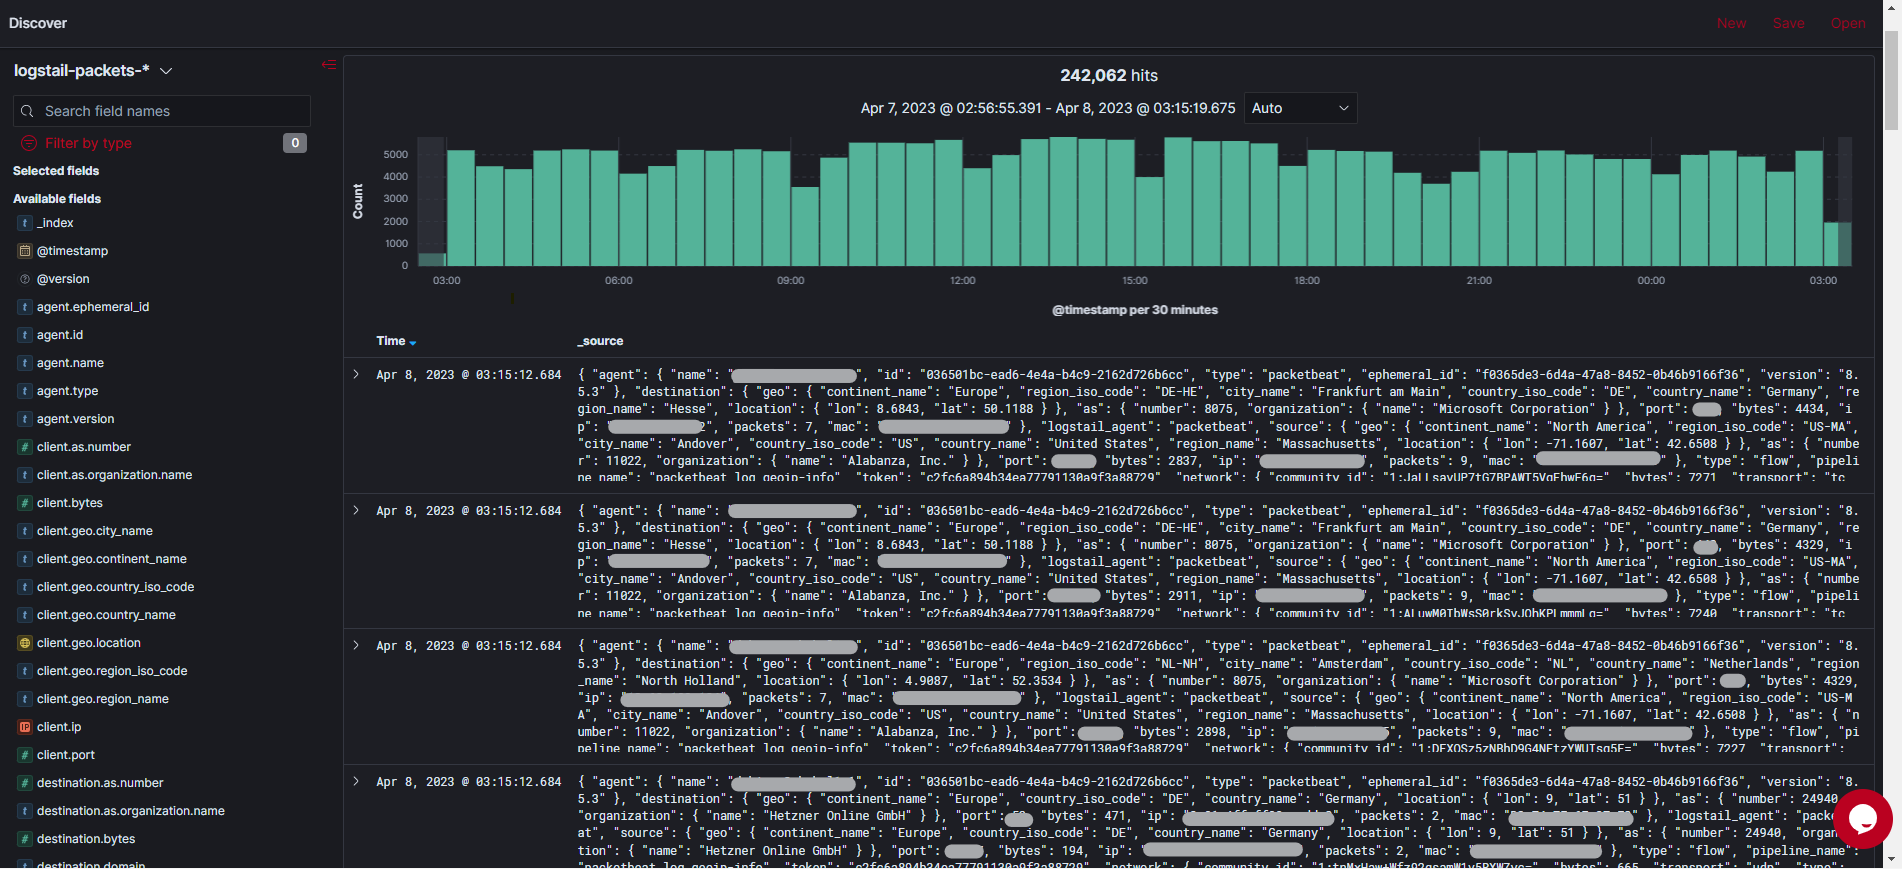
In the discovery you can run searches on your data and apply filters to search for certain fields on a desired time period.
Dashboards
Logstail Dashboards allows you to interactively explore your data. It provides a customizable dashboard that enables you to view your data in near-real-time, create visualizations, and perform data analysis with various visualization options.
It is widely used by organizations to visualize and analyze their data in near-real-time, making it an essential tool for data-driven decision-making.
Overview Dashboard
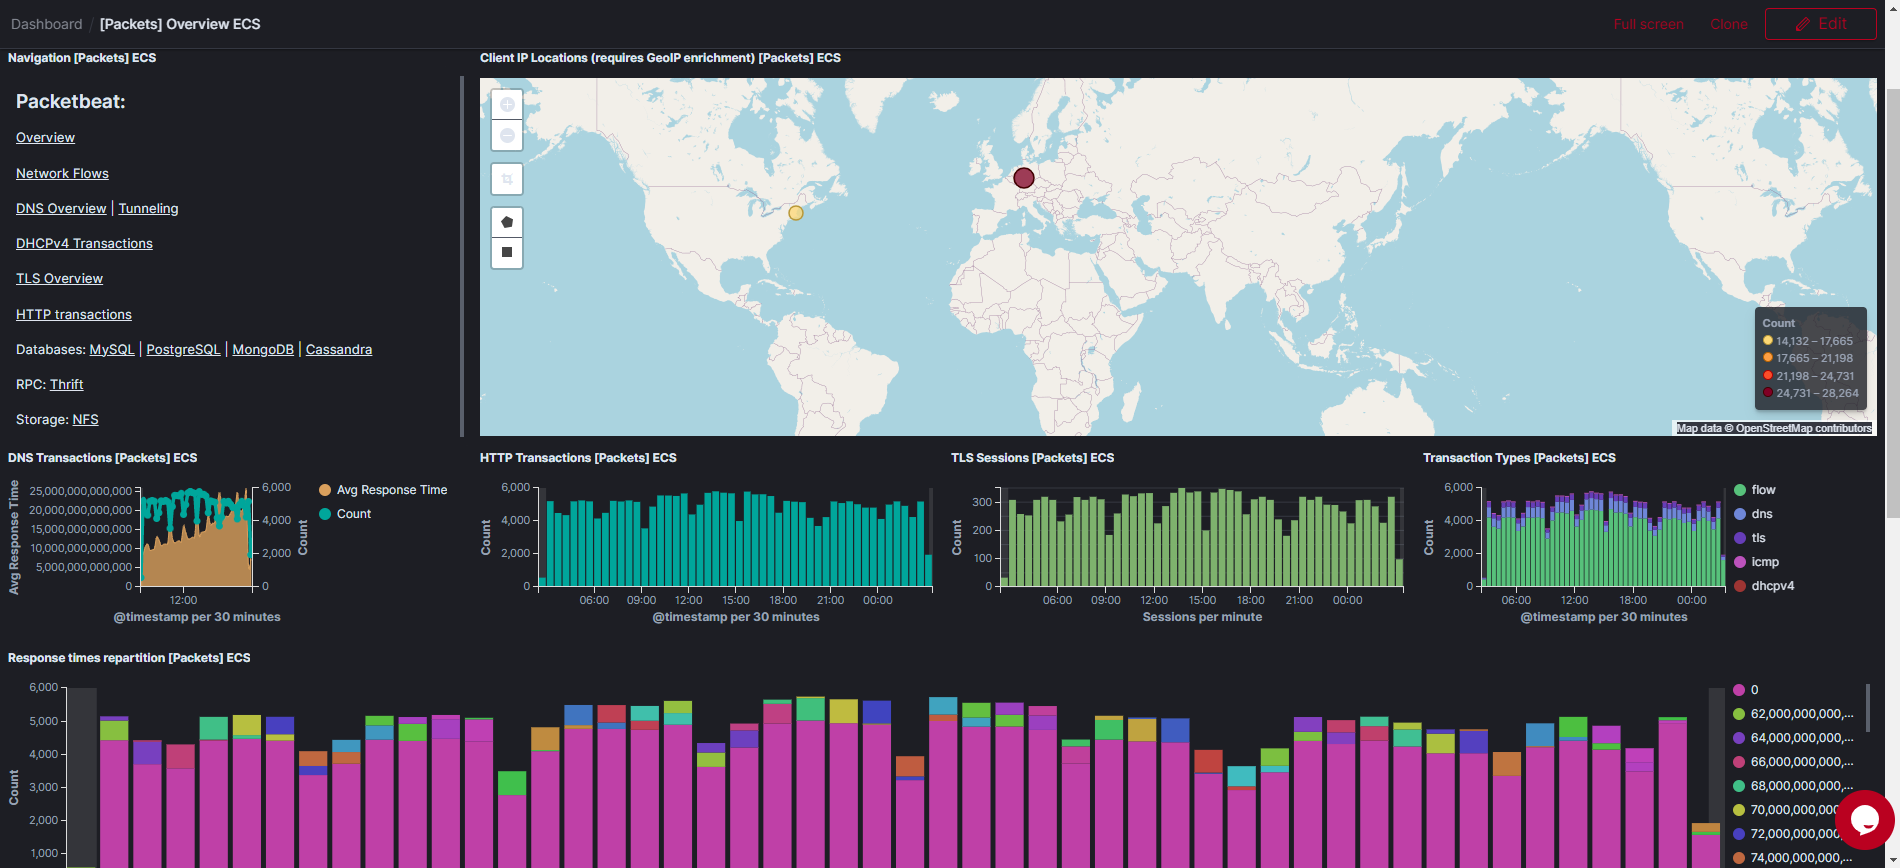
In the prebuilt overview Dashboard you can see the Client IP locations visualized in a world map, and also a variety of general information about your network traffic. You can see an overview of DNS transactions, HTTP transactions, TLS sessions, Transaction Types, Responses times and much more.
Flows Dashboard
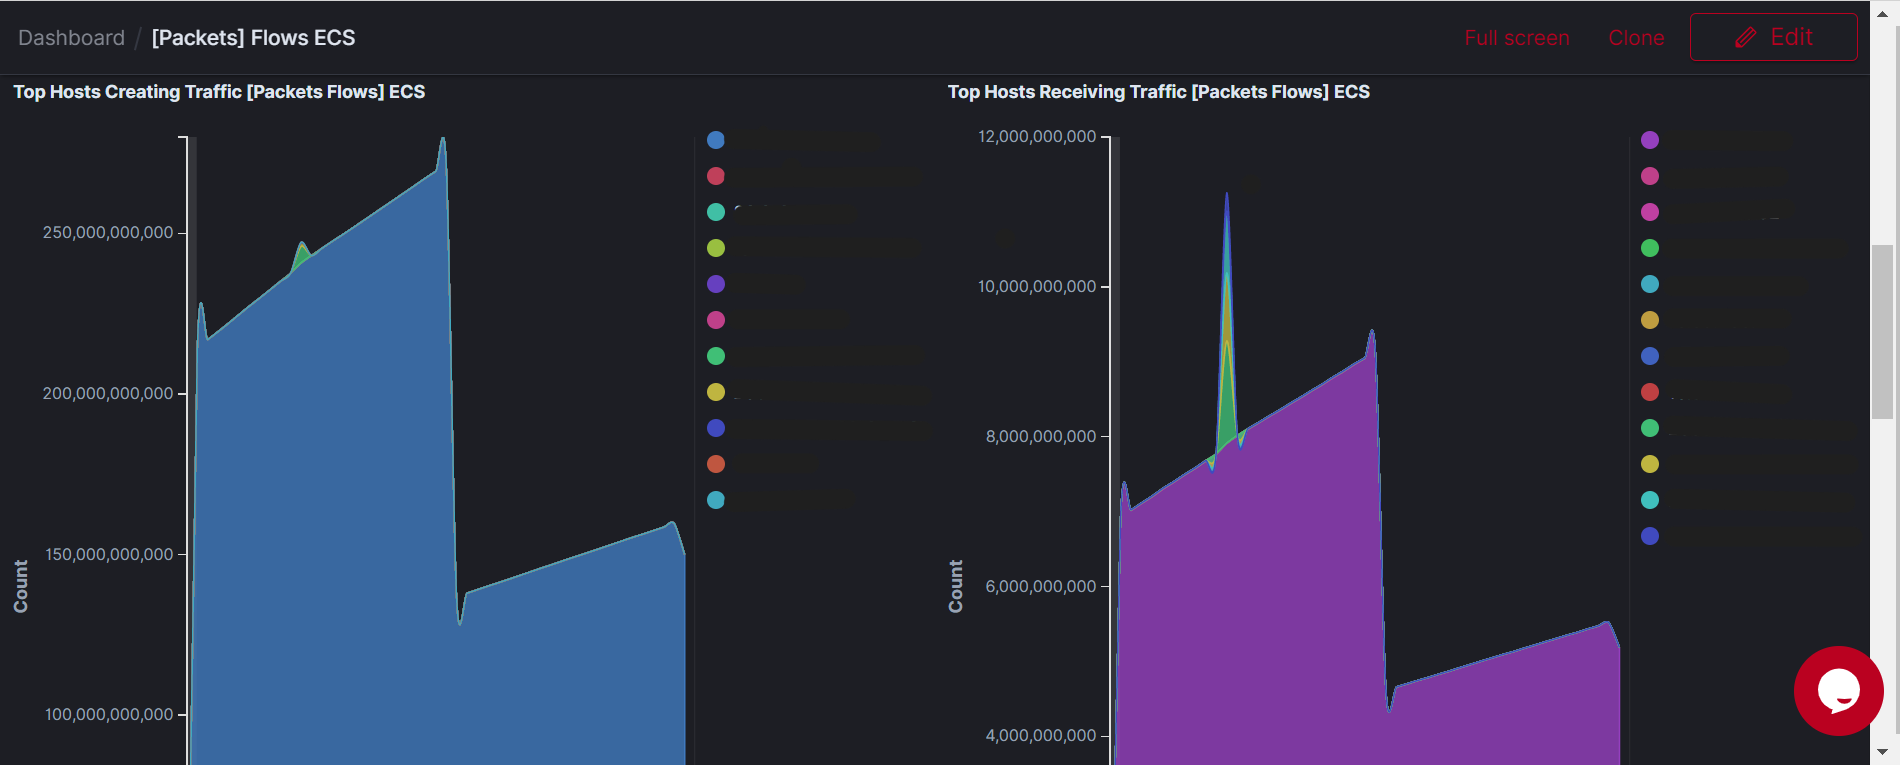
In computer networking, a network flow is a sequence of packets that is sent between two network endpoints, such as a client and a server. A network flow is typically characterized by several properties, including the source and destination IP addresses, source and destination port numbers, transport protocol (such as TCP or UDP), and other metadata.
Network flows are an important concept in network traffic analysis and monitoring, as they provide a way to track and analyze the behavior of network over time. In the flows dashboard you can see the unique connections over time, the top hosts that create and receive traffic and also the number of bytes sent and received.
DNS Dashboard

DNS stands for Domain Name System. It is a hierarchical and decentralized naming system that is used to translate human-readable domain names, such as “google.com”, into IP addresses, such as “216.58.194.174”, which are used by machines to identify and communicate with each other.
In the context of DNS, a DNS question refers to a request made by a DNS resolver to a DNS server for information about a particular domain name. DNS questions can take various forms, depending on the type of DNS query being made. For example, a client might make a simple DNS query to resolve a domain name to an IP address (known as an “A” record query), or it might request information about a mail server associated with a domain (a “MX” record query).
In the DNS dashboard you can see all the information related to the DNS requests such as the response status and codes, the IP addresses, the question type and much more.
DNS Tunneling dashboard
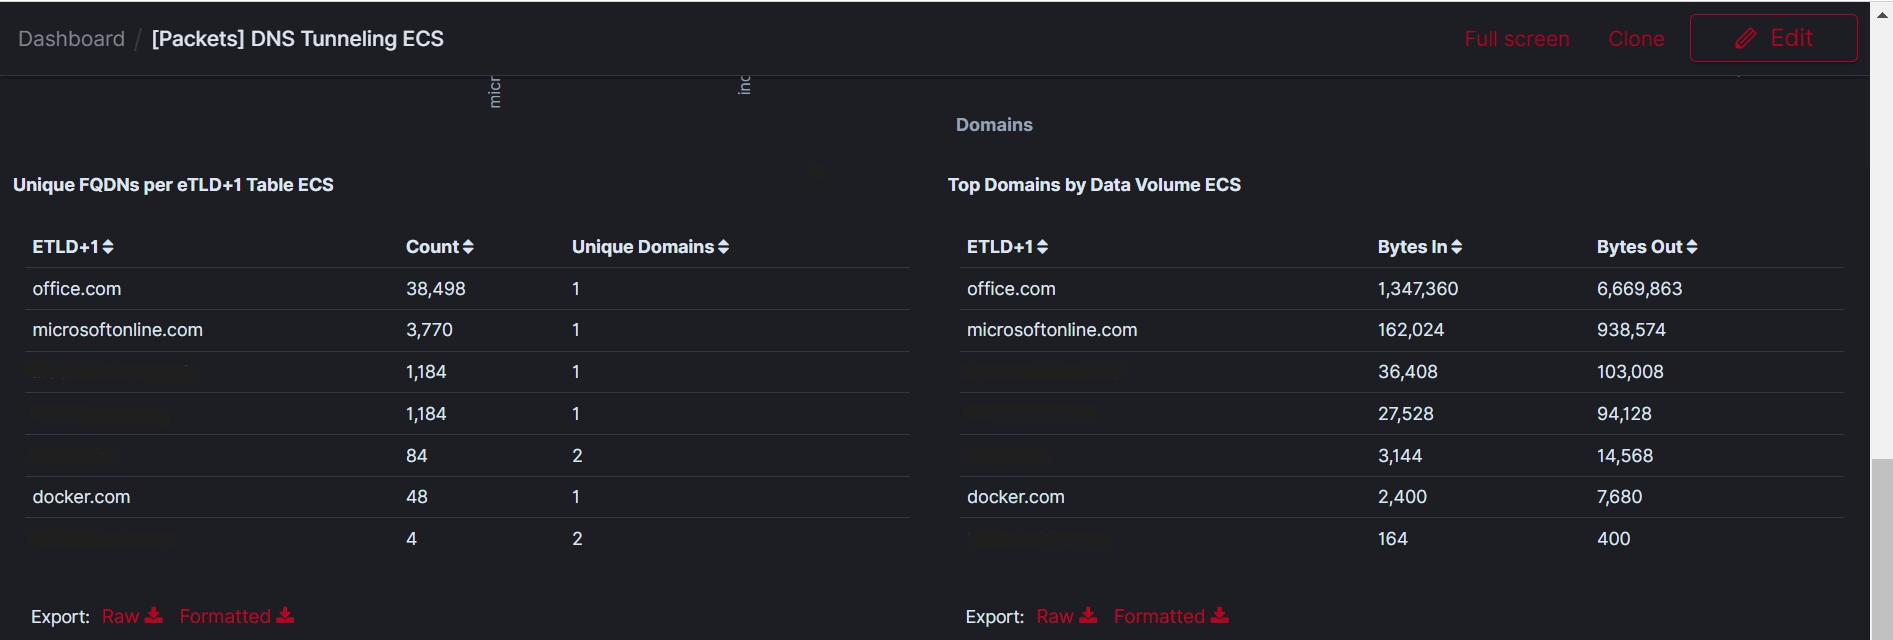
DNS tunneling is a technique that involves using DNS protocol to bypass network security restrictions and communicate with remote servers. It works by encapsulating non-DNS traffic inside DNS packets and sending them to a DNS server that has been configured to act as a tunnel endpoint.
DNS tunneling is considered a security risk, as it can be used to circumvent network security measures and facilitate attacks on network infrastructure. As a result, organizations should take steps to prevent DNS tunneling, such as implementing strict firewall policies, monitoring DNS traffic for suspicious activity, and blocking access to known DNS tunneling tools and services.
In the Tunneling dashboard you can observe the Fully Qualified Domain names and the bytes received and sent during the request.
DHCPv4 Dashboard
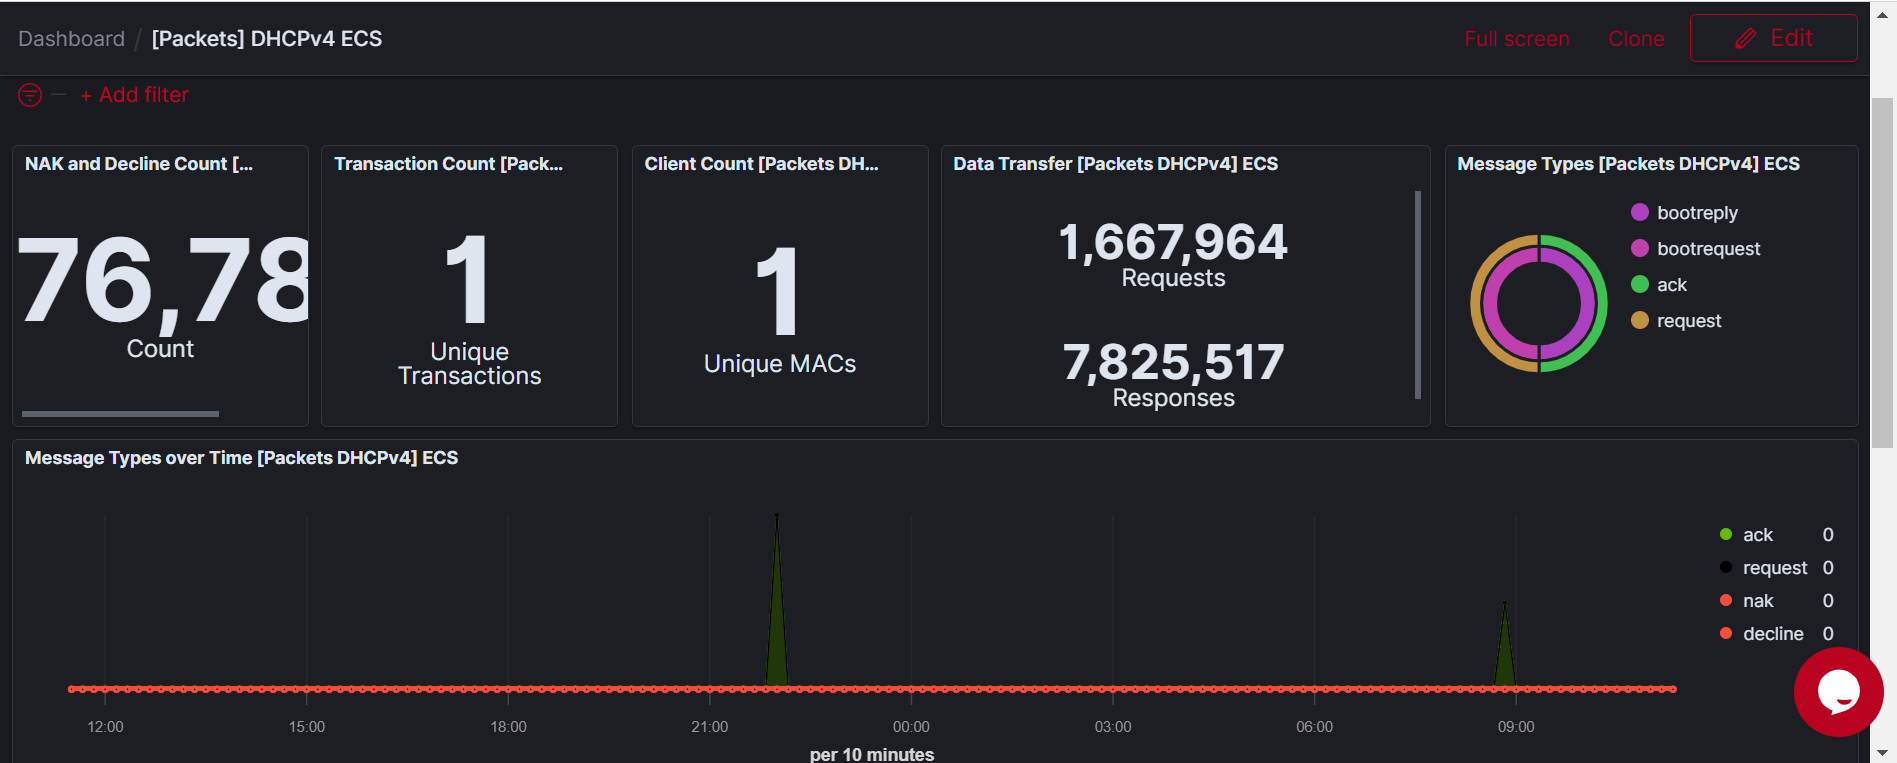
DHCPv4 stands for Dynamic Host Configuration Protocol version 4. It is a protocol used to automatically assign IP addresses and other network configuration settings to devices on a network. DHCPv4 is used in IPv4 networks, where IP addresses are assigned using 32-bit address scheme and it provides a number of benefits, including:
- Reduced administration overhead
- Reduced errors
- Improved network management
DHCPv4 packets are messages that are exchanged between a DHCPv4 client and a DHCPv4 server during the process of assigning IP addresses and other network configuration settings to the client.
In the DHCPv4 dashboard you can observe these messages and have access to their full information such as source and destination IP addresses, message types and much more.
TLS Sessions Dashboard

Transport Layer Security (TLS) is a protocol used to secure communication over the internet. TLS sessions refer to the process establishing and maintaining a secure connection between two systems using TLS protocol. When TLS session is established between a client and a server, the two systems exchange certificates to authenticate each other’s identity. The client and server then negotiate a set of cryptographic algorithms to be used for encrypting and decrypting the data transmitted between them.
In the TLS dashboard you can observe the Server names, the TLS version used, any alerts that might occurred, and also the TLS cypher (cryptographic algorithms) and fingerprints (public key).
HTTP Dashboard
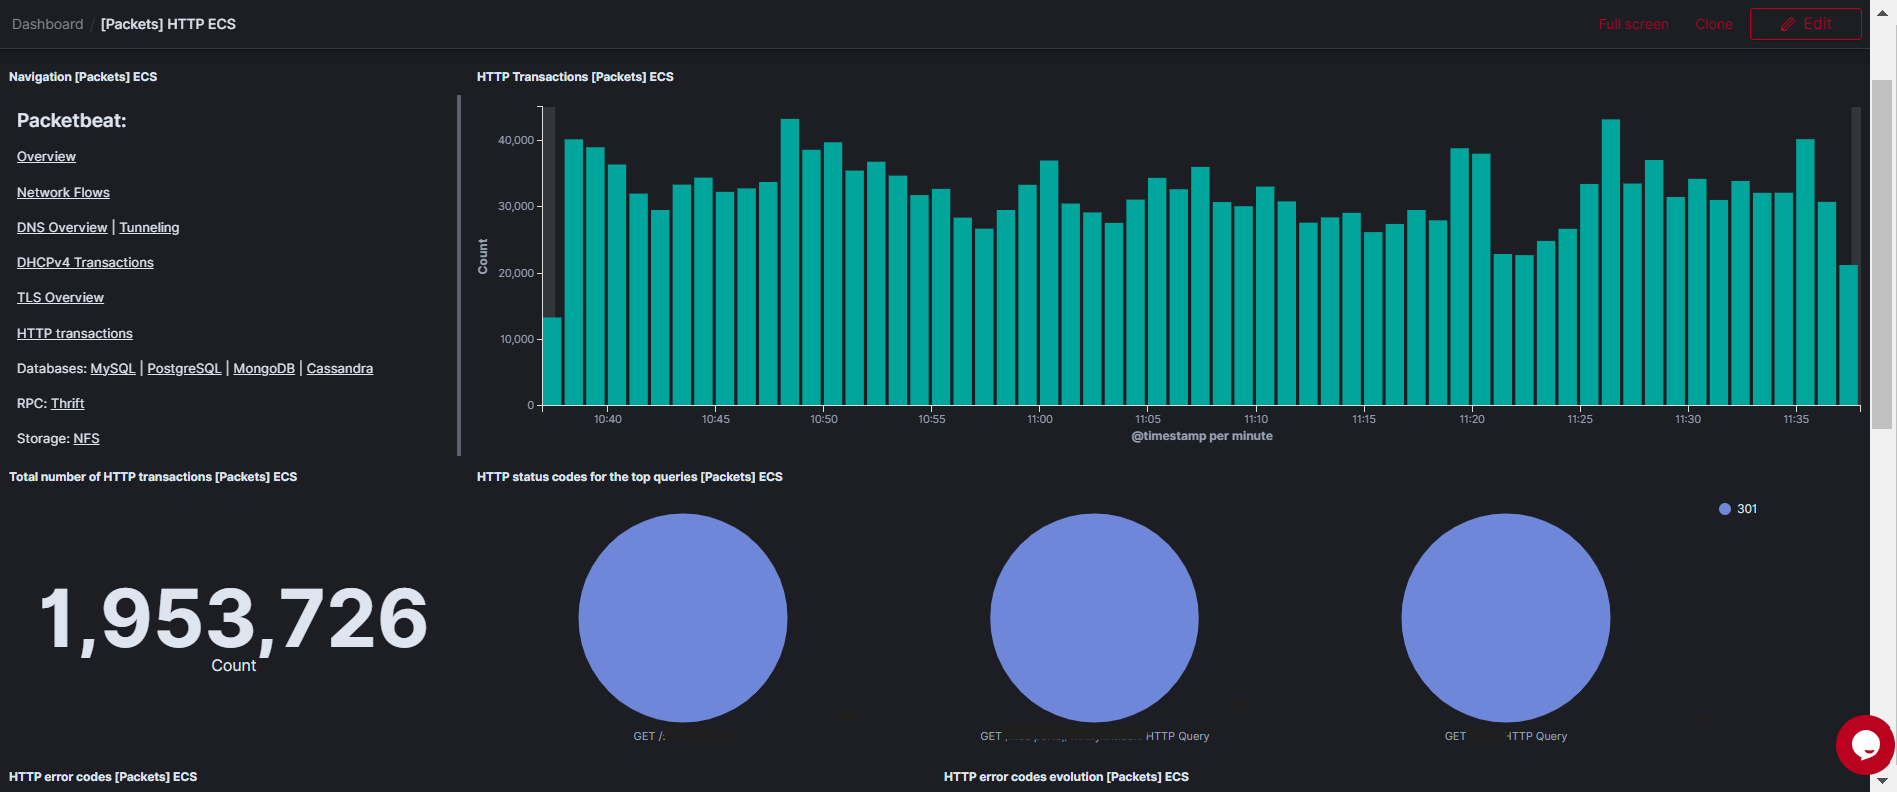
HTTP (Hypertext Transfer Protocol) is a protocol used for sending and receiving data over the internet. It is the foundation of data communication for the World Wide Web. HTTP transactions refer to the exchange of data between a client and a server over the HTTP protocol. When a client (such as a web browser) want to retrieve a resource (such as a web page) from a server, it sends an HTTP request to the server.
The HTTP request typically includes information about the requested resource, such as its URL, as well as any additional information that the server needs to process the request.
Alerts
By setting up Logstail Alert feature and Notifications feature, you can stay stay informed about network activity and take proactive measures to protect your network and your data.
Here are some examples of alerts that you can setup related to your network traffic.
- High network traffic: Create an alert that triggers when the network traffic exceeds a certain threshold. This could be a sign of a DDOS attack or other network issues.
- Unusual network traffic patterns: Create and alert that triggers when the network traffic patterns deviate significantly from the norm. This could be a sign of abnormal network behavior such as a unauthorized user attempting to access that network. To better implement this you can use the Insights feature to create and Anomaly detector.
- Suspicious IP addresses: Create an alert that triggers when network traffic is coming from suspicious IP addresses. This could be a sign of a cyber attack, such as a botnet or a malware infection.
- Slow network performance: Create an alert that triggers when network performance drops below a certain threshold. This could be a sign of network congestion or other issues that could impact network performance.
Conclusion
In conclusion, Logstail offers a powerful networking monitoring solution that offers real-time visibility into your network activity. With Logstail, you can easily monitor network traffic, identify potential issues or security threats, and take proactive measure to protect your network and your data.