March 10, 2023
Monitoring Docker Metrics
What are Docker metrics?
Docker containers metrics are essentially the same metrics that are accessible for every Linux process. They include constraints that Docker has imposed via cgroups, like limits for CPU or memory consumption. Please be aware that sophisticated monitoring programs like Logstail Monitoring may aggregate metrics for containers at several levels, including Docker Hosts/Cluster Nodes, Image Name or ID, and Container Name or ID. This makes it simple to monitor resource utilization by hosts, application kinds (image names), or particular containers. We may employ various levels of aggregations in the examples that follow.
Why should you collect Docker metrics?
The success of any containerized program depends heavily on the ability to successfully monitor containers, which are an essential part of modern application development and deployment.
Monitoring the health and availability of your Docker containers can help you detect and resolve issues quickly, ensuring that your applications are always available to your users. Docker container monitoring is significant. It makes sure that containers function effectively and enables the prompt detection and resolution of any problems. Docker containers should be monitored for a number of reasons:
- Monitoring the resource usage of Docker containers: Can assist ensure that they are operating efficiently and have enough resources to complete their duties. This awareness of the resource utilization of your containers can aid in capacity planning in the future.
- Security: By keeping an eye on your Docker containers, you may spot and stop security lapses like unauthorized access or malicious code injection.
- Cost reduction through resource optimization: Improving the use of your resources reduces costs.
- Compliance: In some cases, monitoring your Docker containers may require compliance with industry regulations or standards
- Health and availability: Monitoring the health and availability of your Docker containers can help you detect and resolve issues quickly, ensuring that your applications are always available to your users
- Monitoring: Can help identify bottlenecks, optimize performance, alert to issues, and provide detailed logs and metrics for debugging.
Logstail SaaS Platform contribution
Docker Metrics are the data in your system, and monitoring is the process of collecting, combining, and analyzing these values to increase your knowledge of the characteristics and behavior of your containerized application. Docker resources are monitored and provide data about the environment. Ingested data is fed to monitoring systems that store, aggregate, visualize, and initiate automatic responses when predetermined criteria are met. Logstail takes over this role, making your job easier and saving you valuable time. You can a better knowledge of your containers and your docker environment with the help of real-time alerting system, AI powered insights and excessive reporting.
Metricbeat Installation
Metricbeat is a lightweight shipper that you can install on your servers to periodically collect metrics from the operating system and from services running on the server.
[Note: You need to have an active Logstail account to follow the links given below.]
To install the Metricbeat agent, you need to use the guide found on the log shippers page.
1. First, you must follow the detailed steps given by the instructions in the link above to install our agent.
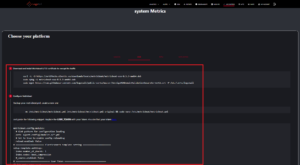
[Note: Don’t forget to specify you operating system as shown above.]
2. As soon as your shipper is set up and ready your next move is to head to the apps page and locate the Docker metrics service, there by pressing: “Add data” you will install the dashboards that will provide you with the visualizations which are used for providing a cleaner and clearer picture of your Docker environment.

[Note: A pop up message should appear on the bottom-right corner of your screen verifying that the dashboards were successfully installed.]
3. Now you can head up at the dashboards page and you will be able to select from a bunch of different dashboards as seen below:

[Note: In case that you have more dashboards, you can always use search.]
This is an example of how [Metrics Docker] Overview ECS dashboard will look:

Logstail Insights plugin.
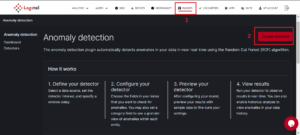
Insights is a powerful AI-Powered plugin. It integrates the Anomaly detection tool which is another important capability and can be leveraged through Logstail Platform. Anomaly detection involves identifying patterns or data points that deviate significantly from the norm, which may indicate unusual or potential problematic activity. Provides the user with data visualizations, such as charts and graphs. These visualizations are helpful in identifying patterns and trends that may not be immediately apparent through simple data analysis. Ιnsights plugin is functioning in real time analyzing new ingested logs. Performing predictive analytics to identify issues before they occur and automatically alerting the user via Alerting Plugin.
Setup Anomaly-Detection for System metrics using Logstail Insights Plugin.
1. Navigate to the Insights plugin page from the top menu and click on Create detector.
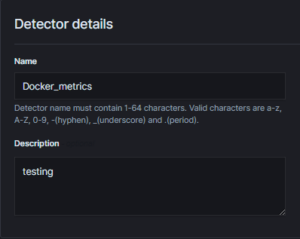
2. Name your detector and add an optional description:
3. Select your Logstail-metrics_docker-* index.
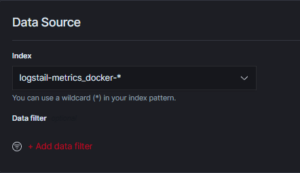
4. Configure the Timestamp field and click next:

5. Configure the Feature settings as you prefer and click next:
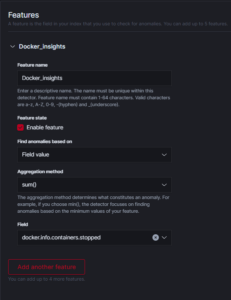
[Note: you can add more than one Features.]
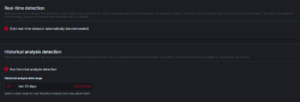
6. Set up your detector jobs and click next. Detector will start running:
Logstail Alerting plugin.
Alerting plugin is used to create and manage alerts based on a specific condition. If conditions are met it will trigger a notification to alert the user.
Why use Logstail Alerting plugin?
The ability provided by the Logstail platform to combine the alerting plugin with system metrics can take your experience in monitoring docker metrics to the next level. Ιt can prevent unexpected outcomes by immediately triggering alerts for any of your containers that might be malfunctioning.
Combining Logstail Alerting Plugin with Docker metrics.
In the following steps we will analyze how you can create your own triggers for your Docker containers with some examples.
Steps to create trigger for CPU usage:
1. First you need to enter the Alerting plugin from the top menu. Click on Monitors tab and create a monitor:

2. On create monitor enter a name for the alert you want to create. Select a monitor type and a monitor definition method:

[Note: Anomaly is selected for the example given you can choose whatever you like to use.]
3. Define detector, which in our case it’s the one we created inside the anomaly detection plugin. Optimize the scheduled time for your monitor.

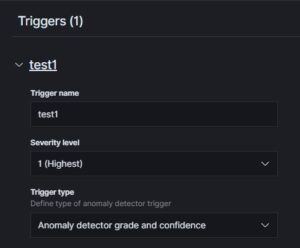
4. After all that you must create a trigger as the example below:
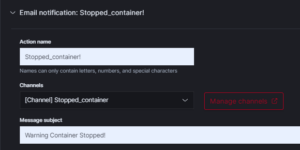
5. Create a new action. With actions you get notified for the alerts you have set.
After you’ve made your configurations hit create on the bottom-right of your page and you are ready to go!
Logstail Reporting plugin.
Reports can be produced with the Reporting Plugin in PNG, PDF, and CSV formats. They can be used to convey crucial information to a variety of stakeholders, like as executives, clients, and staff. Reports can offer insightful information on a variety of data sources, including system metrics, that might not be immediately apparent.
Why use Logstail Reporting plugin?
It provides an easier way for companies and individuals to improve performance and lower the risk of mistakes when they have access to timely, relevant information and display data about threats, activities, and events in a clear, succinct manner.
Generating Reports for Docker metrics.
1. Navigate to Reports plugin from the top menu and click create to create a new Report Definition.

2. Name your Report and you can also add an optional description:
3. Third you need to select the type of your report and your source to provide a desired time range for the report.
4. Choose the file format and click create.
5. Download your report from the Reports table.

Conclusion.
Logstail platform may assist you by combining the technologies so that you are always aware of the status of your system. This will ensure that it is operating properly and help you to stop any unexpected events that might have been fatal sooner. Moreover it can offer an accurate overall view.