March 7, 2023
Ship Nginx logs with Logstail
What is Nginx?
Nginx is a popular opensource web server and reverse-proxy server used by some of the largest websites in the world, including Netflix, Airbnb and Dropbox. It supports many different protocols, such as HTTP, HTTPS, SMTP, POP3, and IMAP. One of its main features is its ability to handle a large number of concurrent connections with minimal resources. This is achieved through its asynchronous, event-driven architecture, which allows it to handle thousands of simultaneous connections with low memory and CPU usage. Another key feature of Nginx is its reverse proxy capability, which allows it to act as a middleman between clients and backend servers. This makes it an ideal choice for load balancing and high availability scenarios, where multiple servers are needed to handle incoming requests. Nginx also includes a powerful caching engine that can significantly improve website performance by caching frequently accessed content in memory, reducing the number of requests that need to be processed by the backend server. Finally, it can handle SSL/TLS encryption efficiently and it can be highly configured and customized to meet specific requirements by supporting a wide range of modules which add functionality and security. Similar to other services, Nginx also generates logs.
Deep-Dive into Nginx logs with Logstail
Nginx logs are an important aspect of Nginx web server administration and monitoring. The logs provide valuable information about web server activity and can be used to troubleshoot issues, monitor performance, and analyze user behavior. Nginx logs are store in plain-text files and contain information about each incoming request and its corresponding response. The logs can be configured to include various details, such as the client IP address, request method, request URI, response status code, and response size. By default, Nginx writes two types of logs: access logs and error logs.
Access logs record every request that Nginx receives, along with various details about the request and response. Access logs are useful for monitoring server performance, tracking user behavior, and analyzing traffic patterns. They can also be used for debugging purposes and troubleshooting issues related to website or application functionality.
Error logs on the other hand, record information about error that occur during server operation. These can include issues related to server configuration, connectivity issues, or problems with backend servers. Error logs can help identify and resolve issues quickly, preventing potential downtime or performance issues.
To manage Nginx logs effectively, administrators should implement a log rotation strategy to ensure that log files do not become too large and to prevent disk space from filling up. This can be achieved by setting up a cron job or using a log rotation tool to compress or delete old log files automatically. Logstail platform is a powerful monitoring tool which can be used to store, manage and observe your Nginx logs.
How to ship Nginx logs
Logstail supports shipping and analysis for both access and error logs.
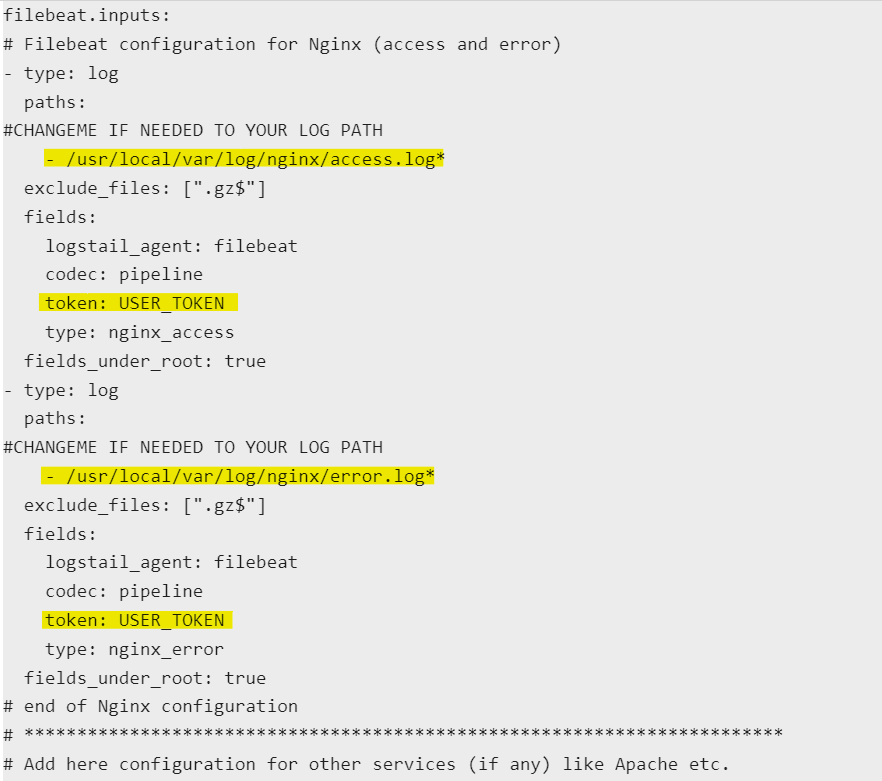
- To ship your nginx logs navigate to the nginx shipper guide and follow the detailed instructions on editing the filebeat.yml file.
- Replace USER_TOKEN with your token and then you need to locate the storage location of your Nginx logs (by default: /var/log/nginx/access) and replace the paths accordingly.
- Then restart filebeat and navigate in the Apps page where you can find the correlated dashboard.
- Install it and you are ready to see your Nginx logs analyzed and visualized in dashboards.
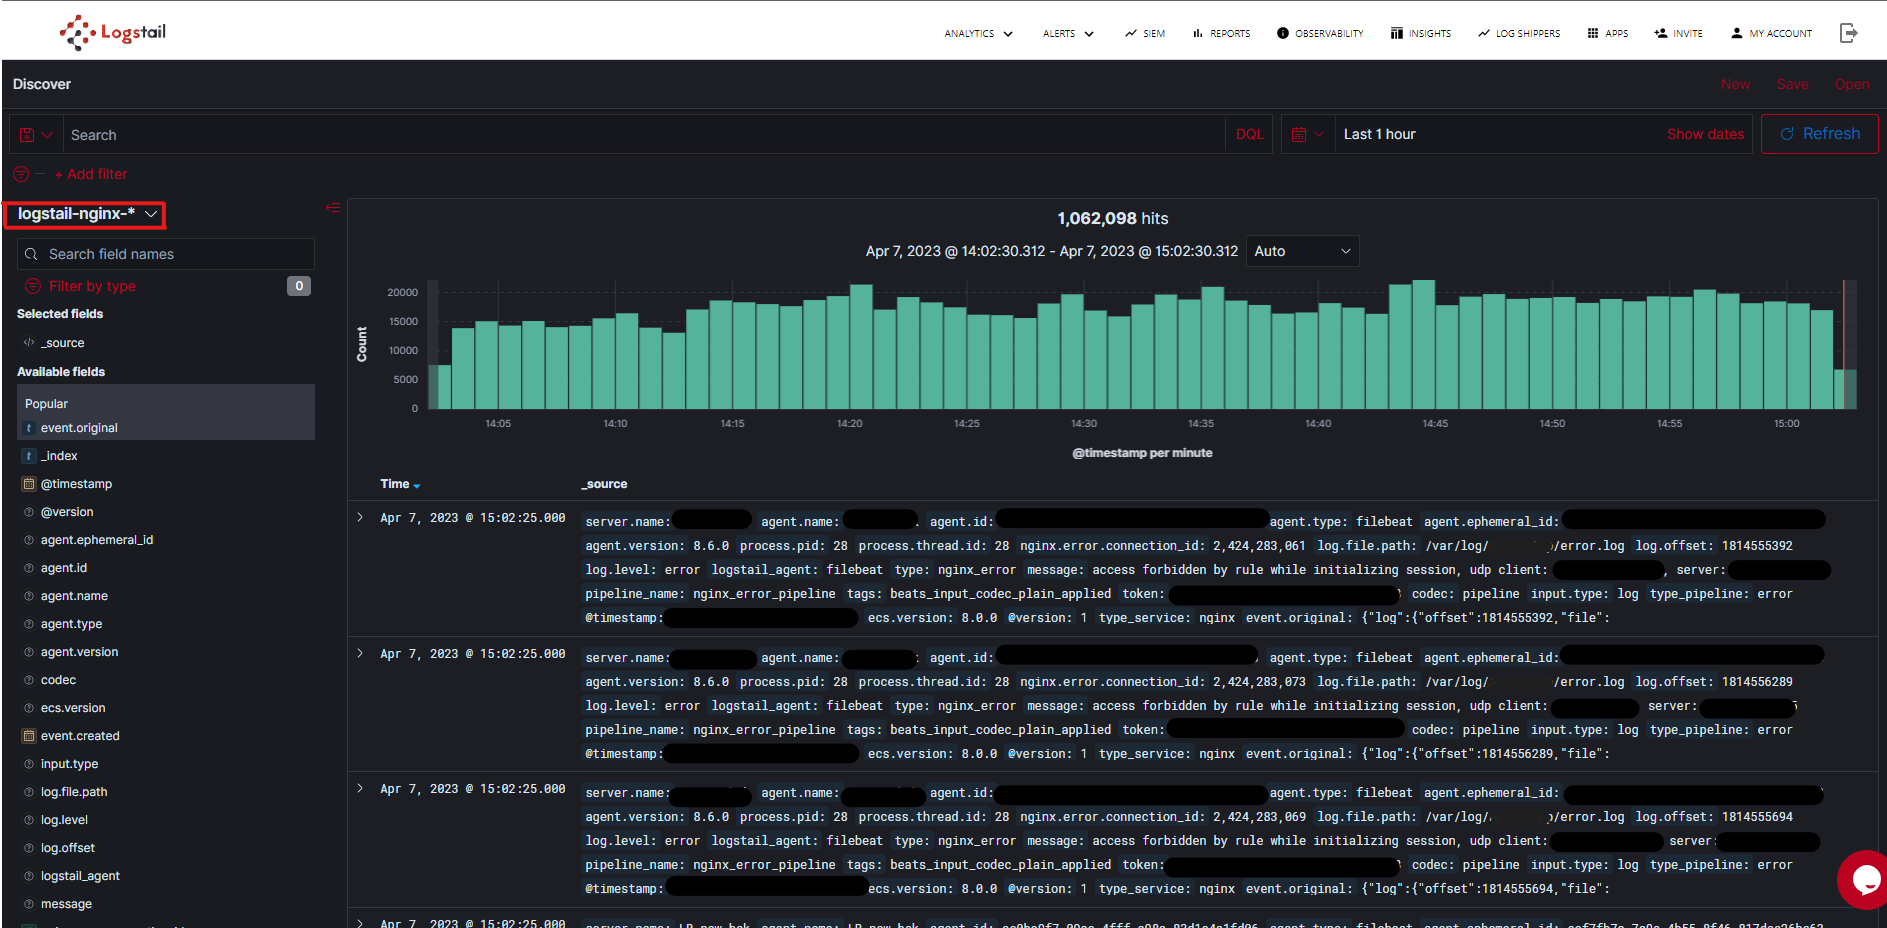
- Now go back to Logstail Platform at Discover page where after selecting the logstail-nginx-* index the nginx logs will appear as time passes. In addition, you can select a specific time-range to view logs from that time.
Visualizations
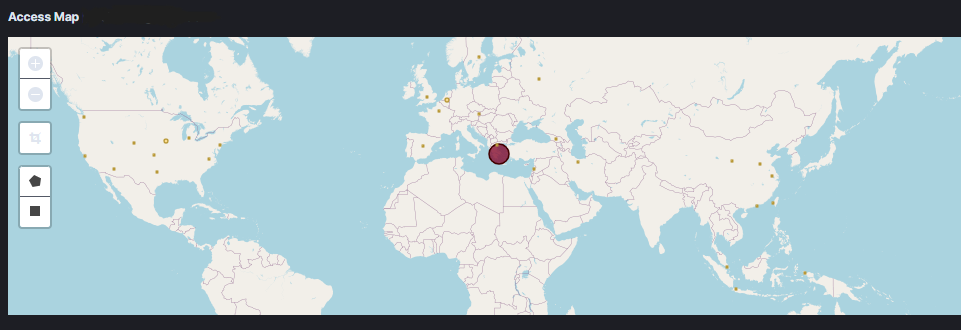
Visualizing raw data is very important because it enables you to more effectively understand, communicate, and act upon the information contained data. In Logstail’s dashboards you can see the value of the Nginx logs such as the location of the requests visualized in a world map, the IP addresses, of the clients, response status codes and much more.
Alerts
Except that, with the Alerts feature you can setup receiving alerts when specific events occur and become critical, that might be attacks to your infrastructure. For example you can setup an alert for when a user pings your server multiple time, indicating that this might be a bot attack, or when a response status code occurs. Overall alerting has great value in detecting threats or abnormal activities.
Insights
Talking about abnormal and unusual activities and traffic, Insights feature is the one which can run historical analysis on long term data and find detect patterns and trends that may not be immediately apparent through simple data analysis. Anomaly detection involves identifying patterns or data points that deviate significantly from the norm, which may indicate unusual or potential problematic activity.
Reports
Finally, Reports feature allows to generate reports and visualizations of your Nginx data. This can help in optimizing the web traffic and gain valuable insights into the data such as sharing information and event with the decision makers inside an organization.
Conclusion
By routing your traffic through Nginx and using Logstail to analyze user behavior and search patterns, organizations can improve their overall performance and make data-driven decisions.
To end up with, if you encounter any problems or have any questions, its always a good idea to reach out Logstail’s support team for assistance or guidance so that your experience is as smooth and successful as possible!