
April 2, 2020
How to analyze MySQL logs with ELK Stack and Logstail.com
MySQL is the most popular open-source relational database management system (RDBMS). It is a free software under the terms of the GNU General Public License and is also available under a variety of proprietary licenses. MySQL is a component of the LAMP web application software stack (and others), which is an acronym for Linux, Apache, MySQL, Perl/PHP/Python and it is used by many database-driven web applications, including Drupal, Joomla, phpBB, and WordPress. MySQL is also used by many popular websites, including Facebook, Flickr, MediaWiki, Twitter, and YouTube.
If you want to find the reason behind slow page loading which is often caused by slow queries in your database, you have to analyze the database logs. The task of analyzing query performance is very important to determine the root cause of these bottlenecks, and log analysis is an essential step to troubleshoot it. MySQL will produce an error log that will contain useful information, reporting when it was started or stopped and when critical errors occurred.
The task of log analysis and management is always challenging and even an experienced analyst will struggle to perform it, because of the vast number of logs produced in an enterprise production environment.
This is where the open-source ELK Stack (Elasticsearch, Logstash, and KIbana) comes into play, to enable a fast and simplified log analysis.
In this post, we will describe how to ship and analyze MySQL logs using Logstail.com, our predictive, cloud-based log management platform that’s built on top of the ELK Stack, but you can follow the steps in the tutorial with any on-premise installation of the ELK Stack as well.
The ELK Stack (Elasticsearch, Logstash, Kibana and Beats) is the world’s most popular open-source log management and log analysis platform, and offers engineers with an extremely easy and effective way of monitoring MySQL databases. To complete the steps shown in this guide you will need a MySQL server installed and active, and either of the following:
- ELK Stack installed and configured by you
- Or just a Logstail.com account!
The basics of MySQL logs
MySQL provides users with various lodging options, including logging to file, conditional logging and syslog logging. MySQL server provides three main log types that can be used for monitoring your installation:
- Slow query logs
- Error logs
- General query logs
1) Slow query logs (mysql_slow_query)
The slow query log consists of SQL statements that take more than long_query_time seconds to execute and require at least min_examined_row_limit rows to be examined. The slow query log can be used to find queries that take a long time to execute and are therefore candidates for optimization. The location generally is /var/log/mysql/mysql-slow.log:
# User@Host: wordpress[wordpress] @  [105.205.305.253]
# Thread_id: 3979  Schema: wordpress  QC_hit: No
# Query_time: 4.303908  Lock_time: 0.000103  Rows_sent: 0  Rows_examined: 1
# Rows_affected: 1  Bytes_sent: 52
SET timestamp=1585775165;
UPDATE `ljsnl_options` SET `option_value` = 'a:2:{i:1;a:3:{s:7:\"user_id\";i:891;s:13:\"last_activity\";i:1585771445;s:10:\"ip_address\";s:13:\"105.205.305.246\";}i:0;a:3:{s:7:\"user_id\";i:891;s:13:\"last_activity\";i:158560;s:10:\"ip_address\";s:13:\"105.205.305.255\";}}' WHERE `option_name` = '_transient_users_online';
2) Error logs (mysql_error)
The error log contains a record of mysqld startup and shutdown times. It also contains diagnostic messages such as errors, warnings, and notes that occur during server startup and shutdown, and while the server is running. For example, if mysqld notices that a table needs to be automatically checked or repaired, it writes a message to the error log.The location is /var/log/mysql/error.log. Example log:
InnoDB: Buffer pool(s) load completed at 200401 10:33:35
3) General query logs
The general query log is a general record of what mysqld is doing. The server writes information to this log when clients connect or disconnect, and it logs each SQL statement received from clients. The general query log can be very useful when you suspect an error in a client and want to know exactly what the client sent to mysqld. By default, the general query log is disabled.
How to ship your logs to ELK Stack (or Logstail.com)
The most user-friendly way to ship your MySQL logs into the ELK Stack (or Logstail.com) is with the use of Filebeat. Filebeat belongs to the family of Beats which are open source data shippers that you install as agents on your server to send operational data to Elasticsearch. In essence, there is no real need to add Logstash to handle the processing, which makes the set-up of the pipeline much simpler. Instead of ELK Stack, you can choose Logstail.com to ship your logs directly without the need to use Filebeat MySQL module (this is even easier!).
Installing Filebeat to the MySQL server
First, add Elastic’s signing key so that the downloaded package can be verified (skip this step if you’ve already installed packages from Elastic):
wget -qO - https://artifacts.elastic.co/GPG-KEY-elasticsearch | sudo apt-key add -
Next, add the repository definition to your system
echo "deb https://artifacts.elastic.co/packages/7.x/apt stable main" | sudo tee -a /etc/apt/sources.list.d/elastic-7.x.list
Update and install Filebeat with:
sudo apt-get update && sudo apt-get install filebeat
Steps to ship MySQL logs to Logstail.com
To make things even easier, Logstail.com gives you the opportunity to automatically parse the MySQL logs, without the need of Logstash or Filebeat’s MySQL module. In order to operationally use your logs, all you have to do is install Filebeat to MySQL Server and modify the Filebeat.yml configuration file on your Logstail.com:
1) Configure MySQL to write general query logs, error logs, and slow-query logs
In the MySQL configuration file (/etc/mysql/my.cnf), paste these lines:
general_log_file = /var/log/mysql/mysql.log
general_log= 1 log_slow_queries = /var/log/mysql/mysql-slow.log
long_query_time = 1
log-queries-not-using-indexes = 1
Restart MySQL
sudo /etc/init.d/mysql restart
If you are using mariadb, you must create a new file in /etc/mysql/mariadb.conf.d and then paste the following into this new file:
[mysqld]
log-error = /var/log/mysql/error.log
general_log = 1
general_log_file = /var/log/mysql/mysql.log
slow_query_log = 1
slow-query_log_file = /var/log/mysql/mysql-slow.log
long_query_time = 2
2) Download the SSL certificate
Firstly, to secure ship your logs to Logstail.com (encrypted), you have to download our public SSL certificate and create the appropriate folder:
wget https://raw.githubusercontent.com/logstail/public-certs/master/SectigoRSADomainValidationSecureServerCA.crt -P /etc/certs/logstail/
3) Editing Filebeat
Backup your filebeat.yml and create a new one with the following command :
mv /etc/filebeat/filebeat.yml /etc/filebeat/filebeat.yml_original && sudo nano /etc/filebeat/filebeat.yml
Paste the following configuration to the new file (for Debian, taken from shippers page):
filebeat.inputs:
# Filebeat configuration for MySQL (error and slowlog)
- type: log
  paths:
    - /var/log/mysql/error.log*
  exclude_files: [".gz$"]
  fields:
    codec: plain
    token: USER_TOKEN
    type: mysql_error
  fields_under_root: true
- type: log
  paths:
    - /var/log/mysql/mysql-slow.log*
    - /var/log/mysql/-slow.log*
    - /var/log/mysqld.log*
  exclude_files: [".gz$"]
  multiline:
    pattern: "^(# User@Host: |# Time: )"
    negate: true
    match: after
  fields:
    codec: plain
    token: USER_TOKEN
    type: mysql_slowlog
  fields_under_root: true
  exclude_lines: ["^[\/\w\.]+, Version: .* started with:.*", "^# Time:.*"]
# end of MySQL configuration
# ************************************************************************
# Add here configuration for other services (if any) like nginx etc.
# ************************************************************************
output.logstash:
  hosts: ["apps.logstail.com:35723"]
  ssl.certificate_authorities: ["/etc/certs/logstail/SectigoRSADomainValidationSecureServerCA.crt"]
Save the file and restart Filebeat with:
sudo service filebeat restart
Finally, check that data is received from your Filebeat.
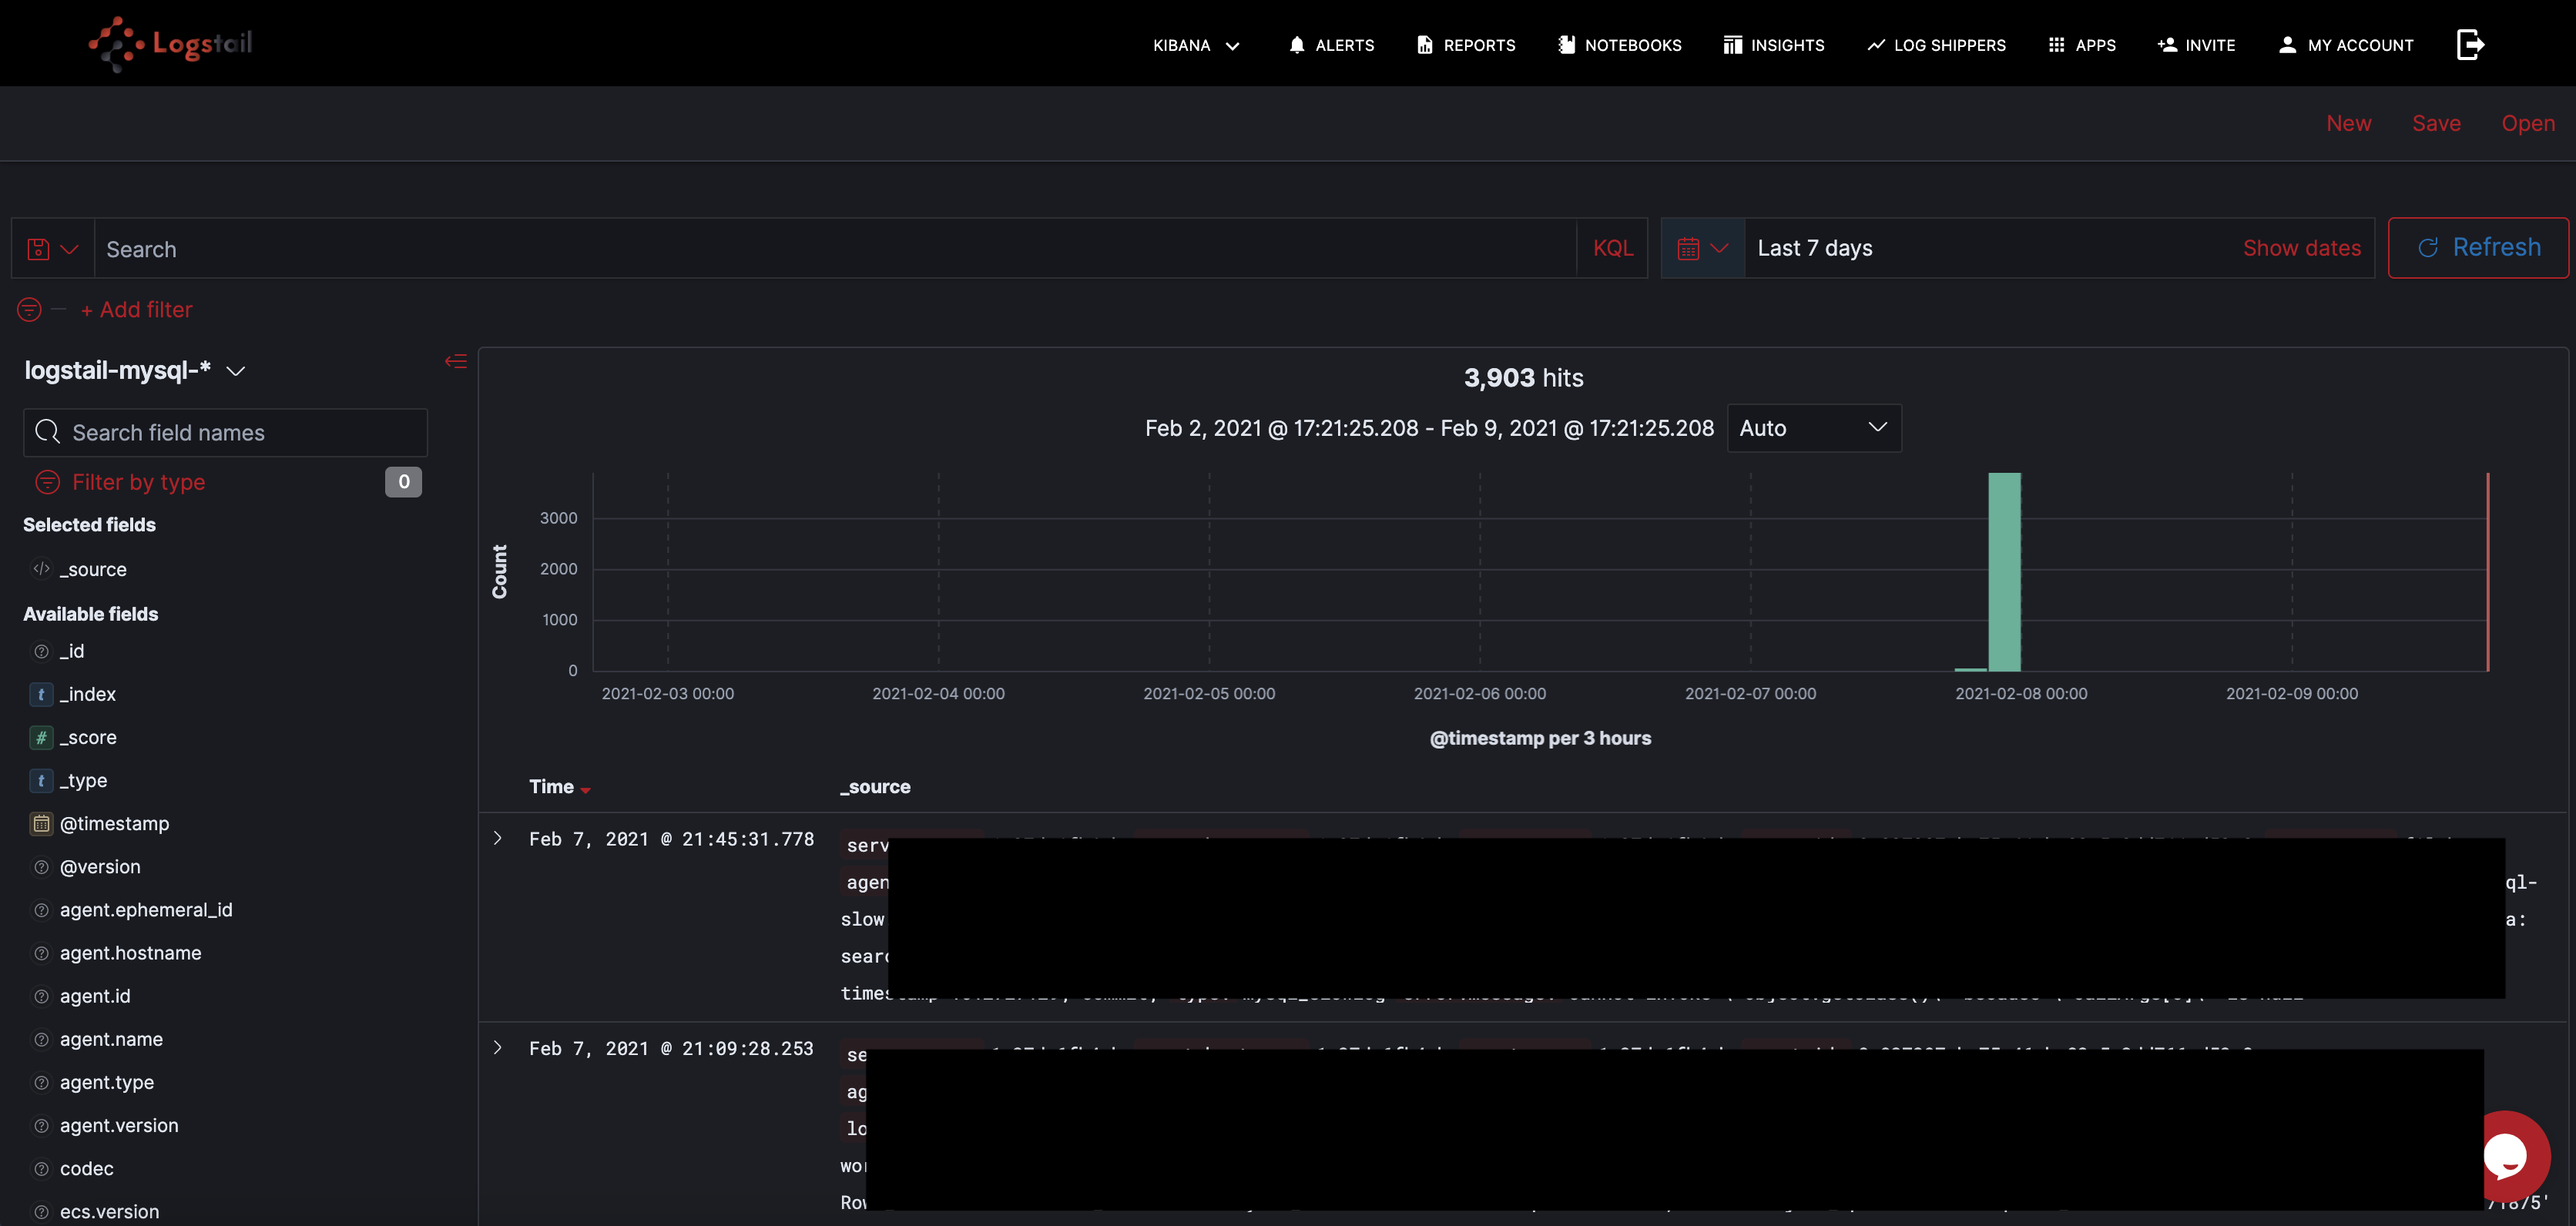
How to analyze MySQL logs
Now you can query your logs with the help of Kibana. Kibana gives you many query options and features like auto-suggest and auto-complete make searching much easier. For example, you can search with free text. Just enter your search query in the search field as follows(search word: Italy): Another option is to conduct field-level searches if you want to be more specific. For example, you can search for any MySQL error log for the last day using this search query: The query options are actually extremely varied depending on your actually needs, which can be analytics, troubleshooting, security and many more.
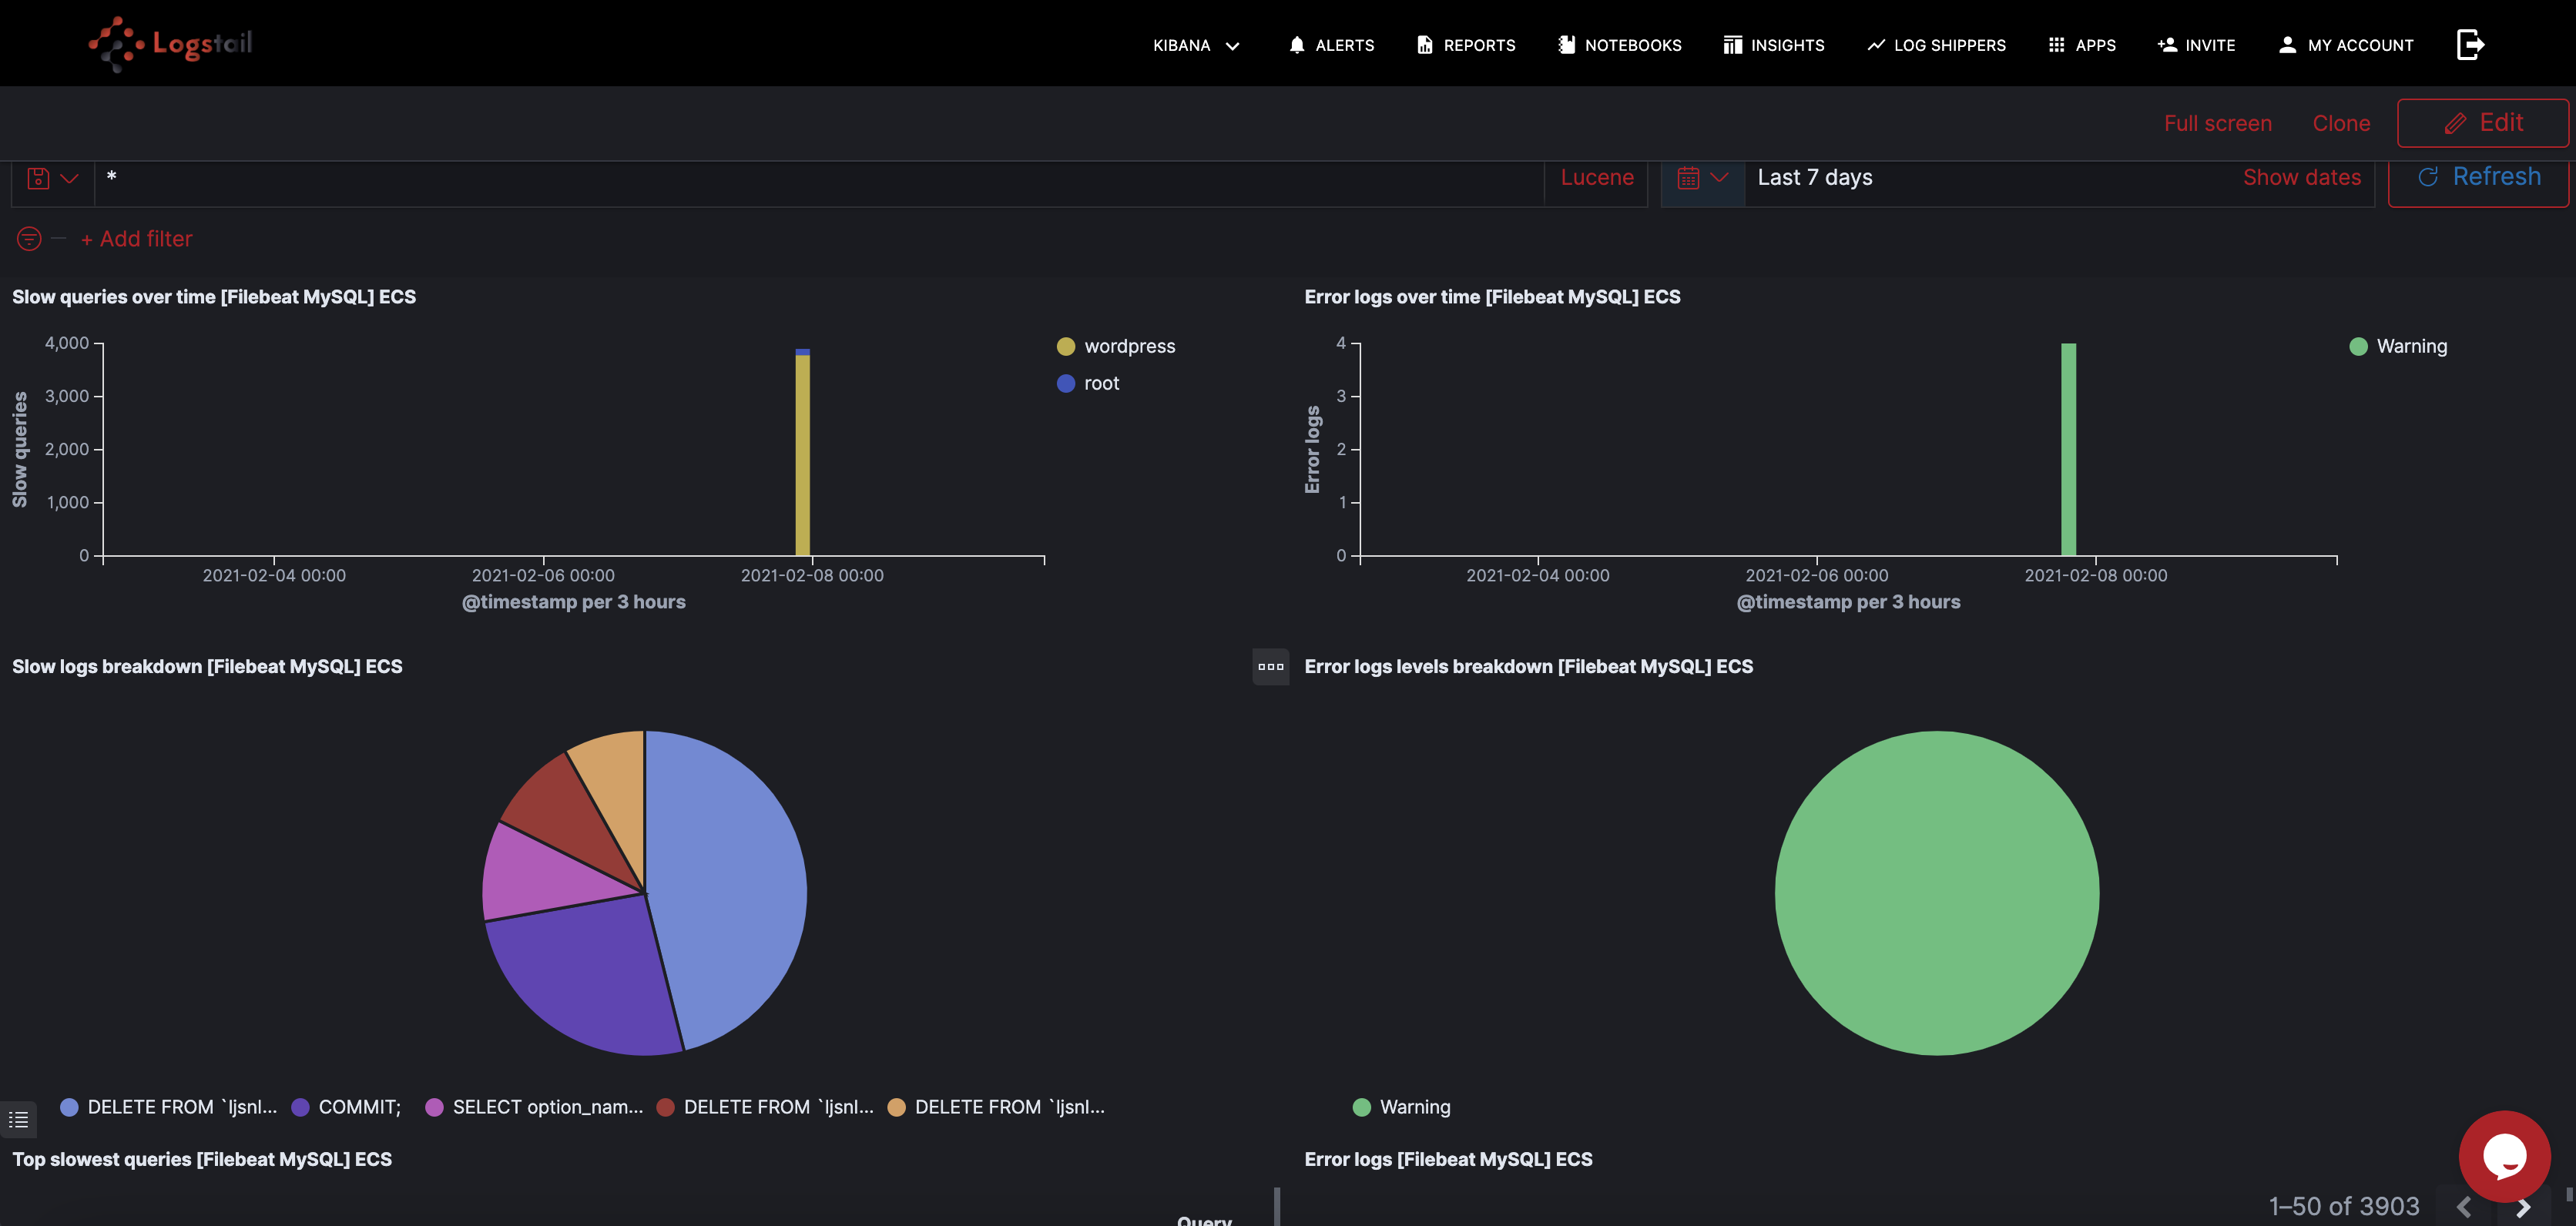
How to visualize them
With Kibana you can instantly visualize your data with dashboards in many different ways.
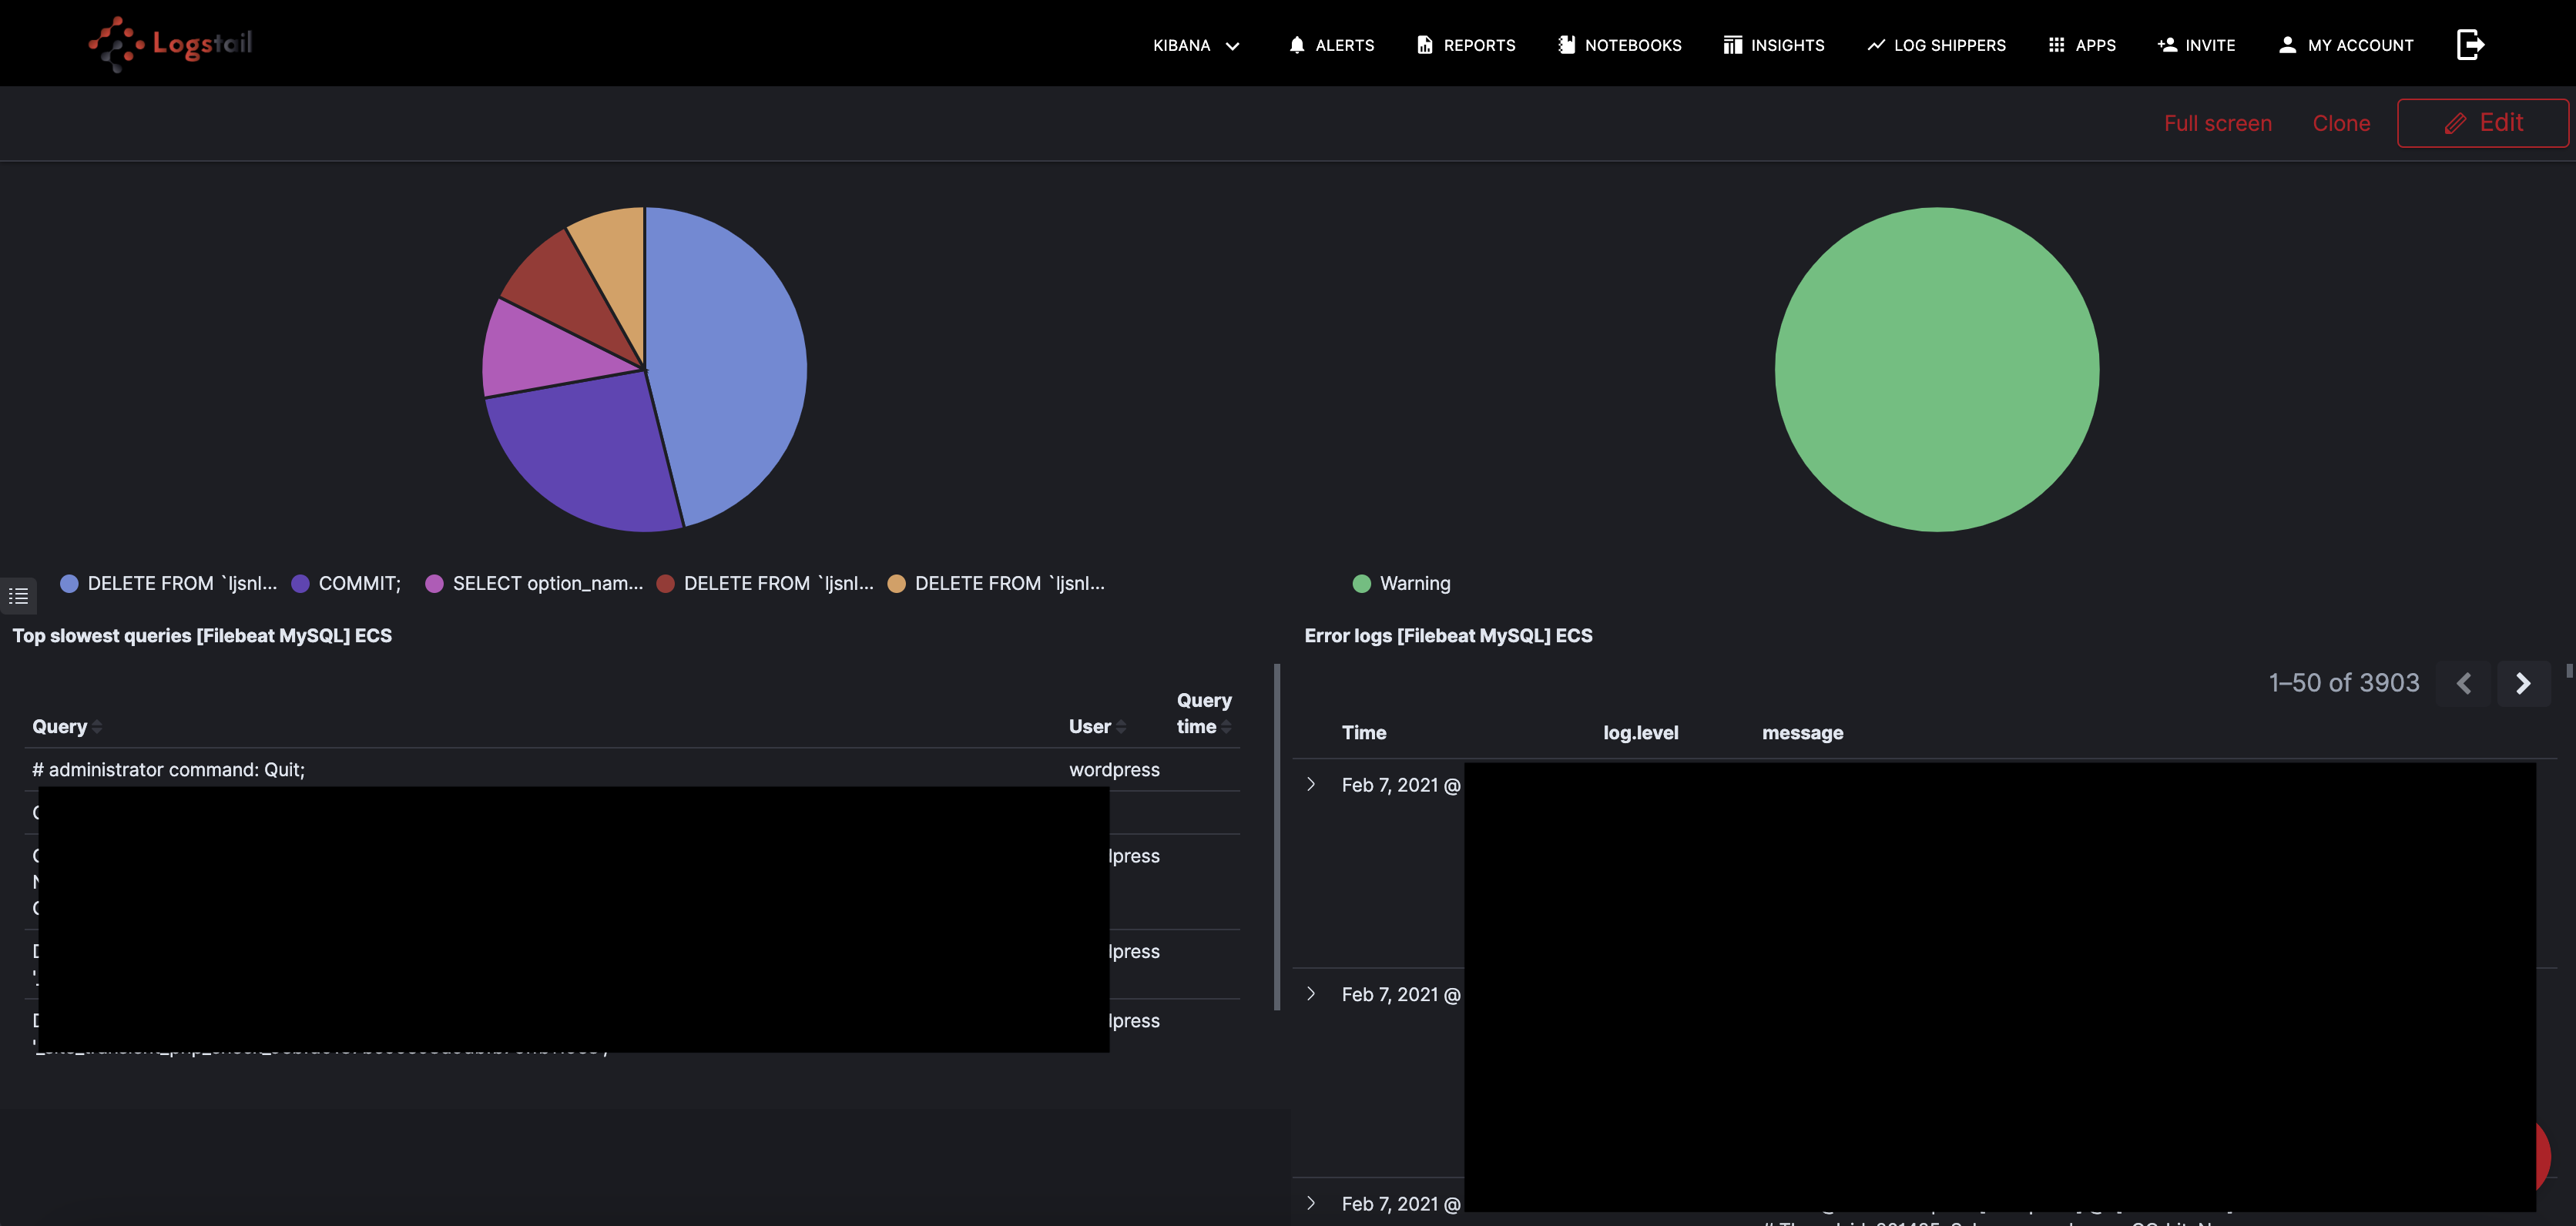
Error and slow log dashboard
For MySQL logs and any other database logs, the usual place to start is the error and slow query requests. This helps you find potential issues and optimize your infrastructure where it needs. Logstail.com provides a ready dashboard to provide a visualized form of this information, as shown below:
Alerting
Alerting is an extremely useful feature provided by Logstail. We provide you a mechanism to receive alerts through Slack when certain indicators exceed the thresholds been defined. Now you have the ability to immediately realize performance-related or other issues and take the appropriate measures to mitigate the problem. This functionality is a must when you want to have real-time operational awareness of your systems. You can find a thorough article about how are alerting mechanism works, here.
Conclusion
Logstail with its advanced features brings the functionality of ELK Stack to your hands. You don’t have to be an engineer in order to set up and use Elasticsearch anymore. Now you can convert your data into actionable insights with just some tweaks. You can maximize the performance of your infrastructure or be notified of potential problems and take the appropriate actions. Sign-up for a free demo in order to realize yourself the power of Logstail !