March 16, 2020
How to analyze Apache logs with ELK stack and Logstail.com
Apache (officially Apache HTTP Server) is the most popular open-source, cross-platform web server today. It’s actively maintained by the Apache Software Foundation and its popularity grows from the fact that engineers can extend its core functionalities to suit their per project needs. Apache is being used by Facebook, LinkedIn, Cisco, eBay, IBM, General Electric, Adobe, and many more. Its popularity is verified by the fact that today powers around 45% of websites globally. Apart from that, it’s also one of the oldest web servers, with its first release back in 1995. If you want to effectively monitor an Apache HTTP Server, you have to access the two main types of metrics data available, the Apache logs and Apache status (you can see the status if you enable mod_status from Apache configuration, and Apache is running in http://<apache_ip>/server-status). In this article, we will focus on logs. The amount of data being generated is vast, and to be able to effectively collect and analyze Apache logs the most effective way is through a log management and analysis platform, like ELK Stack. To complete the steps shown in this guide you will need an Apache HTTP server installed and active, and either of the following:
- ELK Stack installed and configured by you
- Or just a Logstail.com account!
The basics of Apache logs
The Apache HTTP server provides two log types that can be used for monitoring your installation:
- access logs
- error logs
Both logs are located, by default, under /var/log/apache2 on Ubuntu/Debian, and /var/log/httpd/ on MacOS, RHEL, CentOS and Fedora.
1) Access logs
The access logs store all the requests processed by the Apache HTTP server and are used for performance monitoring. Additionally, they can be used for resolving security issues. They contain a lot of valuable information about the requests to Apache (which pages people are viewing, the success status of requests, and how long the request took to respond). Example log:
[192.168.33.1 - - [18/Jan/2020:16:22:00 +0000] "GET /favicon.ico HTTP/1.1" 404 504 "http://192.168.33.72/" "Mozilla/5.0 (Macintosh; Intel Mac OS X 10_12_0) AppleWebKit/537.36 (KHTML, like Gecko) Chrome/54.0.2840.98 Safari/537.36"
2) Error logs
The error logs store diagnostic information and any error encountered while processing the requests. They are mostly used for operational monitoring and troubleshooting because they contain diagnostic information and errors logged while processing requests. Example log:
[Sat Jan 18 16:22:00 2020] [error] [client 192.168.33.1] File does not exist: /var/www/favicon.ico, referer: http://192.168.33.72/
How to ship your logs to local ELK Stack
The most user-friendly way to ship your Apache logs into the ELK Stack (or Logstail.com) is with the use of Filebeat. Filebeat belongs to the family of Beats which are open source data shippers that you install as agents on your server to send operational data to Elasticsearch. In essence, there is no real need to add Logstash to handle the processing, which makes the set-up of the pipeline much simpler. Instead of ELK Stack you can choose Logstail.com to ship your logs directly without the need to use Filebeat Apache module (this is even more easier!).
1) Installing Filebeat to the Apache server
First, add Elastic’s signing key so that the downloaded package can be verified (skip this step if you’ve already installed packages from Elastic):
wget -qO - https://artifacts.elastic.co/GPG-KEY-elasticsearch | sudo apt-key add -
Next, add the repository definition to your system
echo "deb https://artifacts.elastic.co/packages/7.x/apt stable main" | sudo tee -a /etc/apt/sources.list.d/elastic-7.x.list
Update and install Filebeat with:
sudo apt-get update && sudo apt-get install filebeat
2) Enabling the Apache Module (not needed in Logstail.com case)
Another option to ship your logs to ELK Stack is by enabling the Apache Filebeat module (not needed in Logstail.com case). To do this, enter:
sudo filebeat modules enable apache
Next, use the following setup command to load a recommended index template and deploy sample dashboards for visualizing the data in Kibana:
sudo filebeat setup -e
And last but not least, start Filebeat with:
sudo service filebeat start
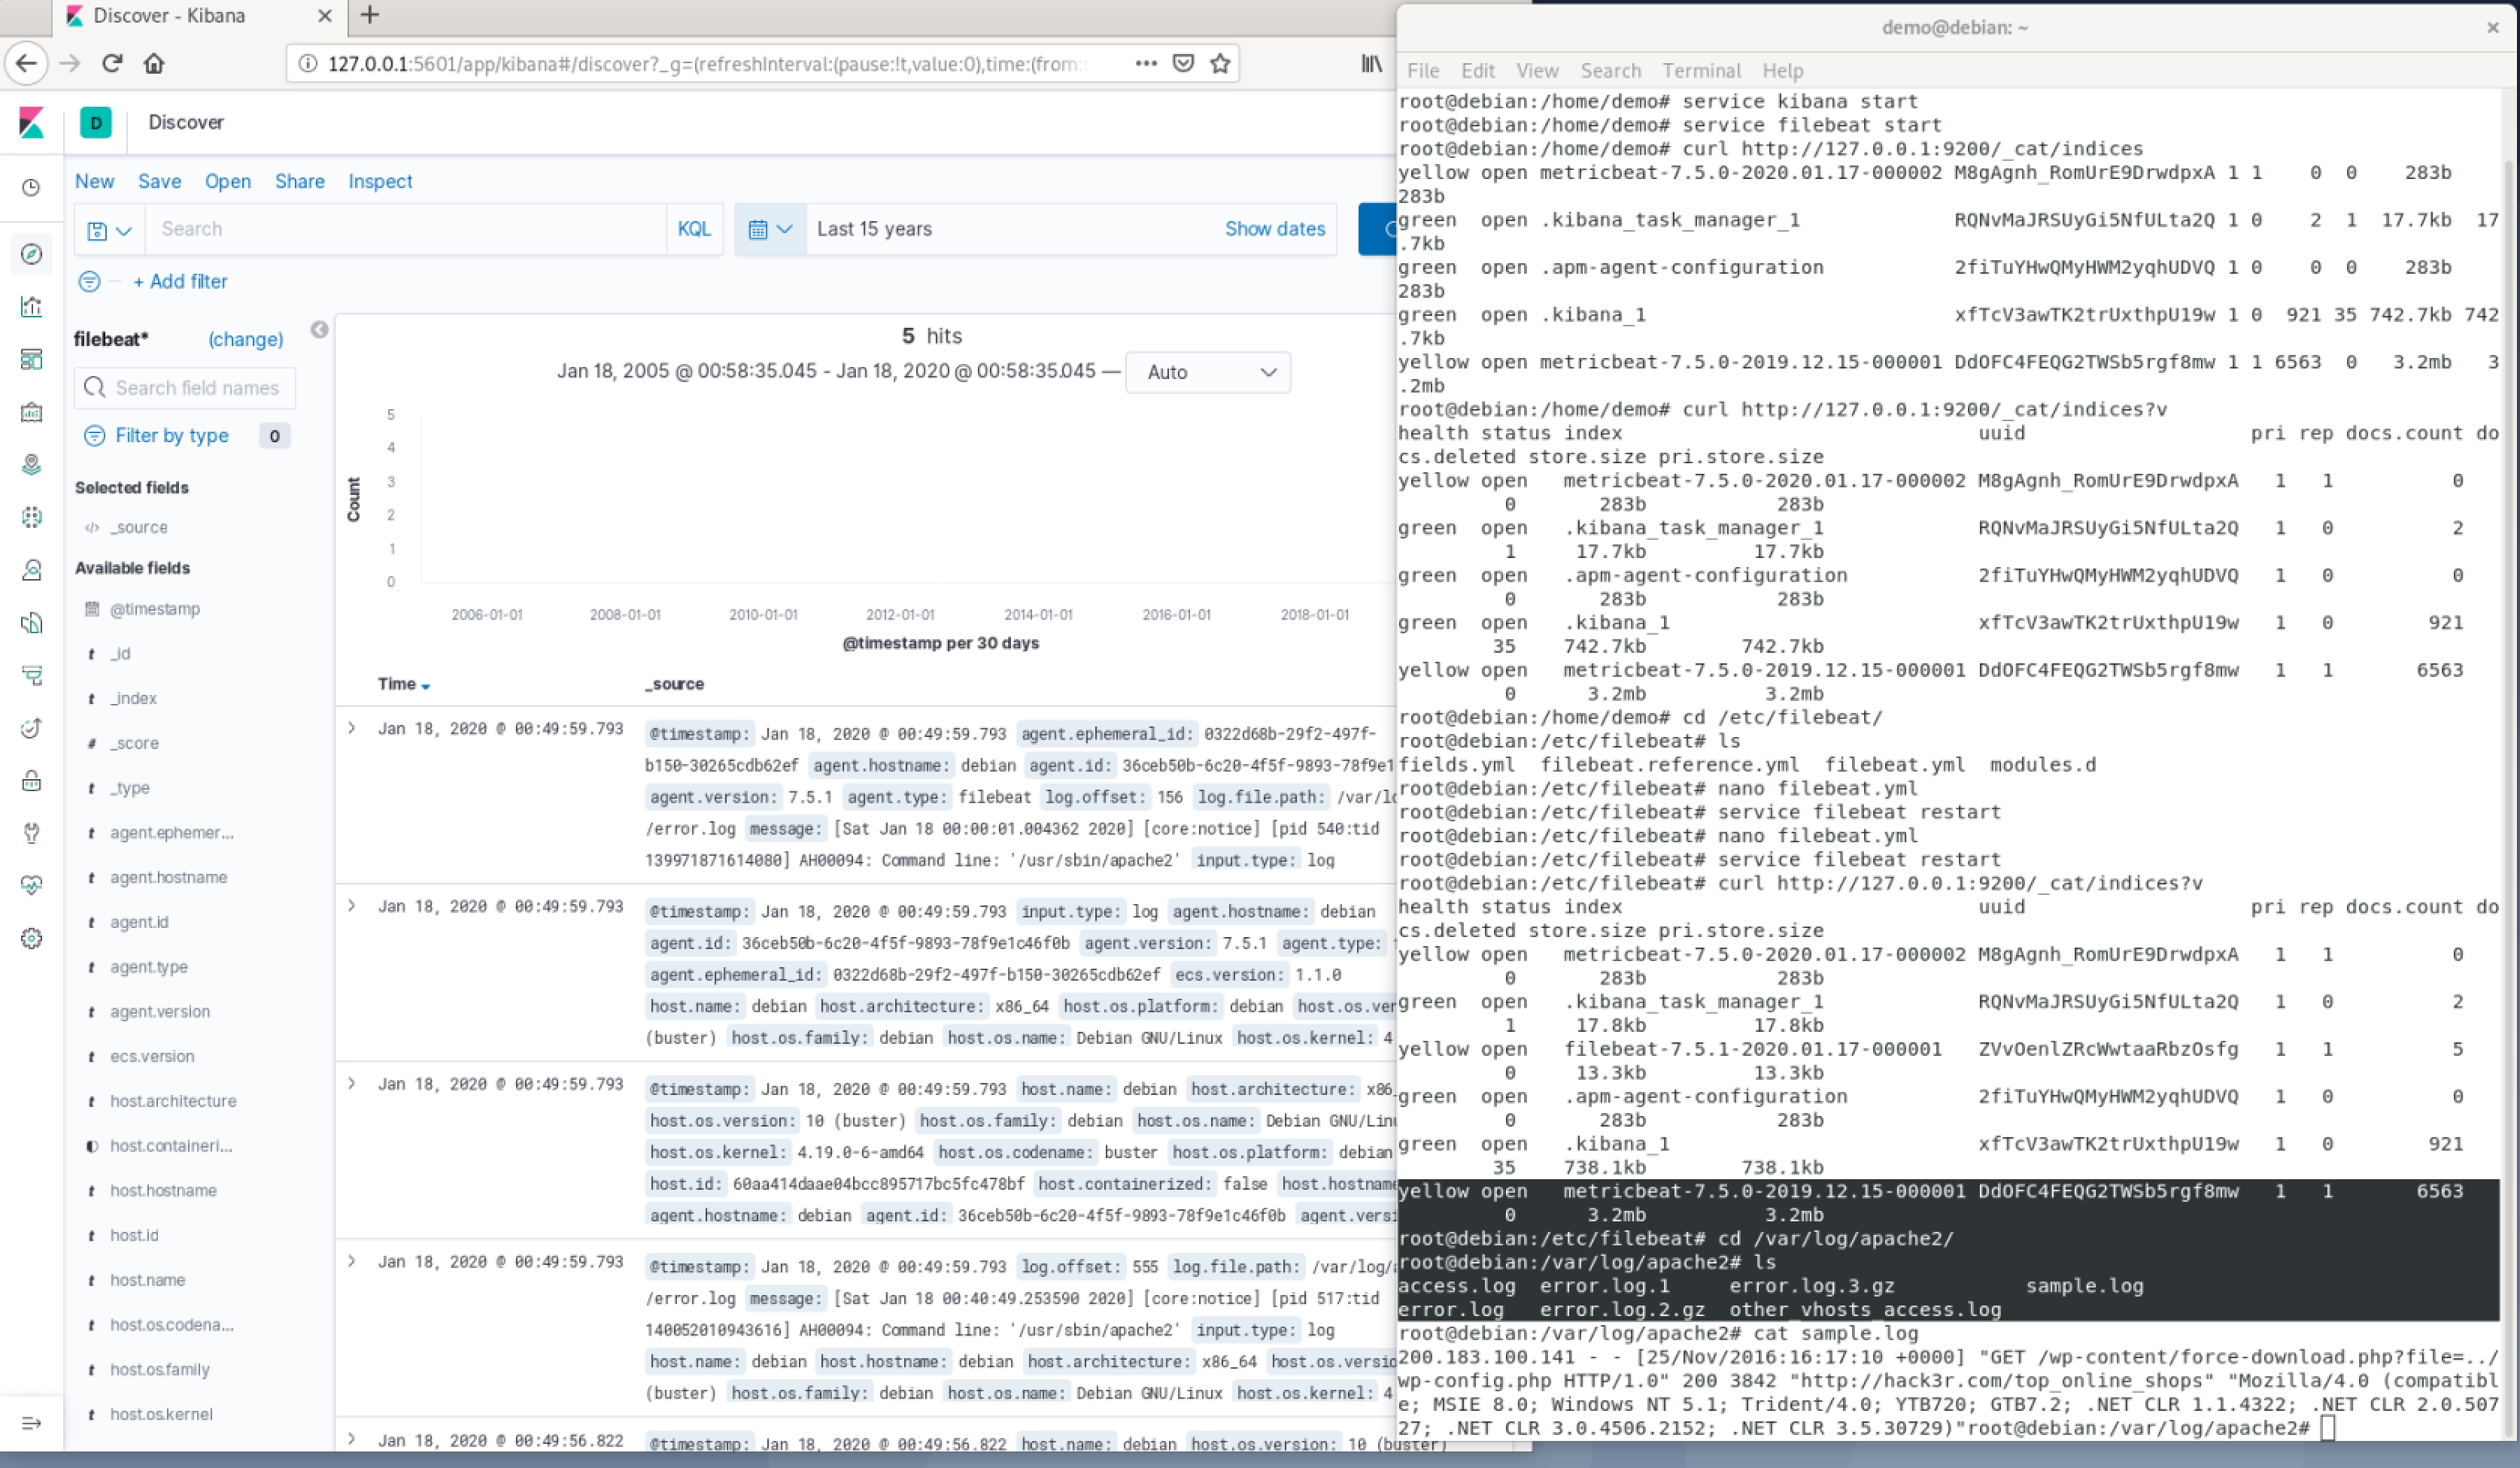
It’s time to verify that your pipeline working as expected. First, cURL the Elasticsearch to verify a “filebeat-*” index has indeed been created:
curl -X GET "localhost:9200/_cat/indices?v"
Next, open Kibana at: http://localhost:5601— the index will be defined and loaded automatically and the data visible on the Discover page:
Steps to ship Apache logs to Logstail.com
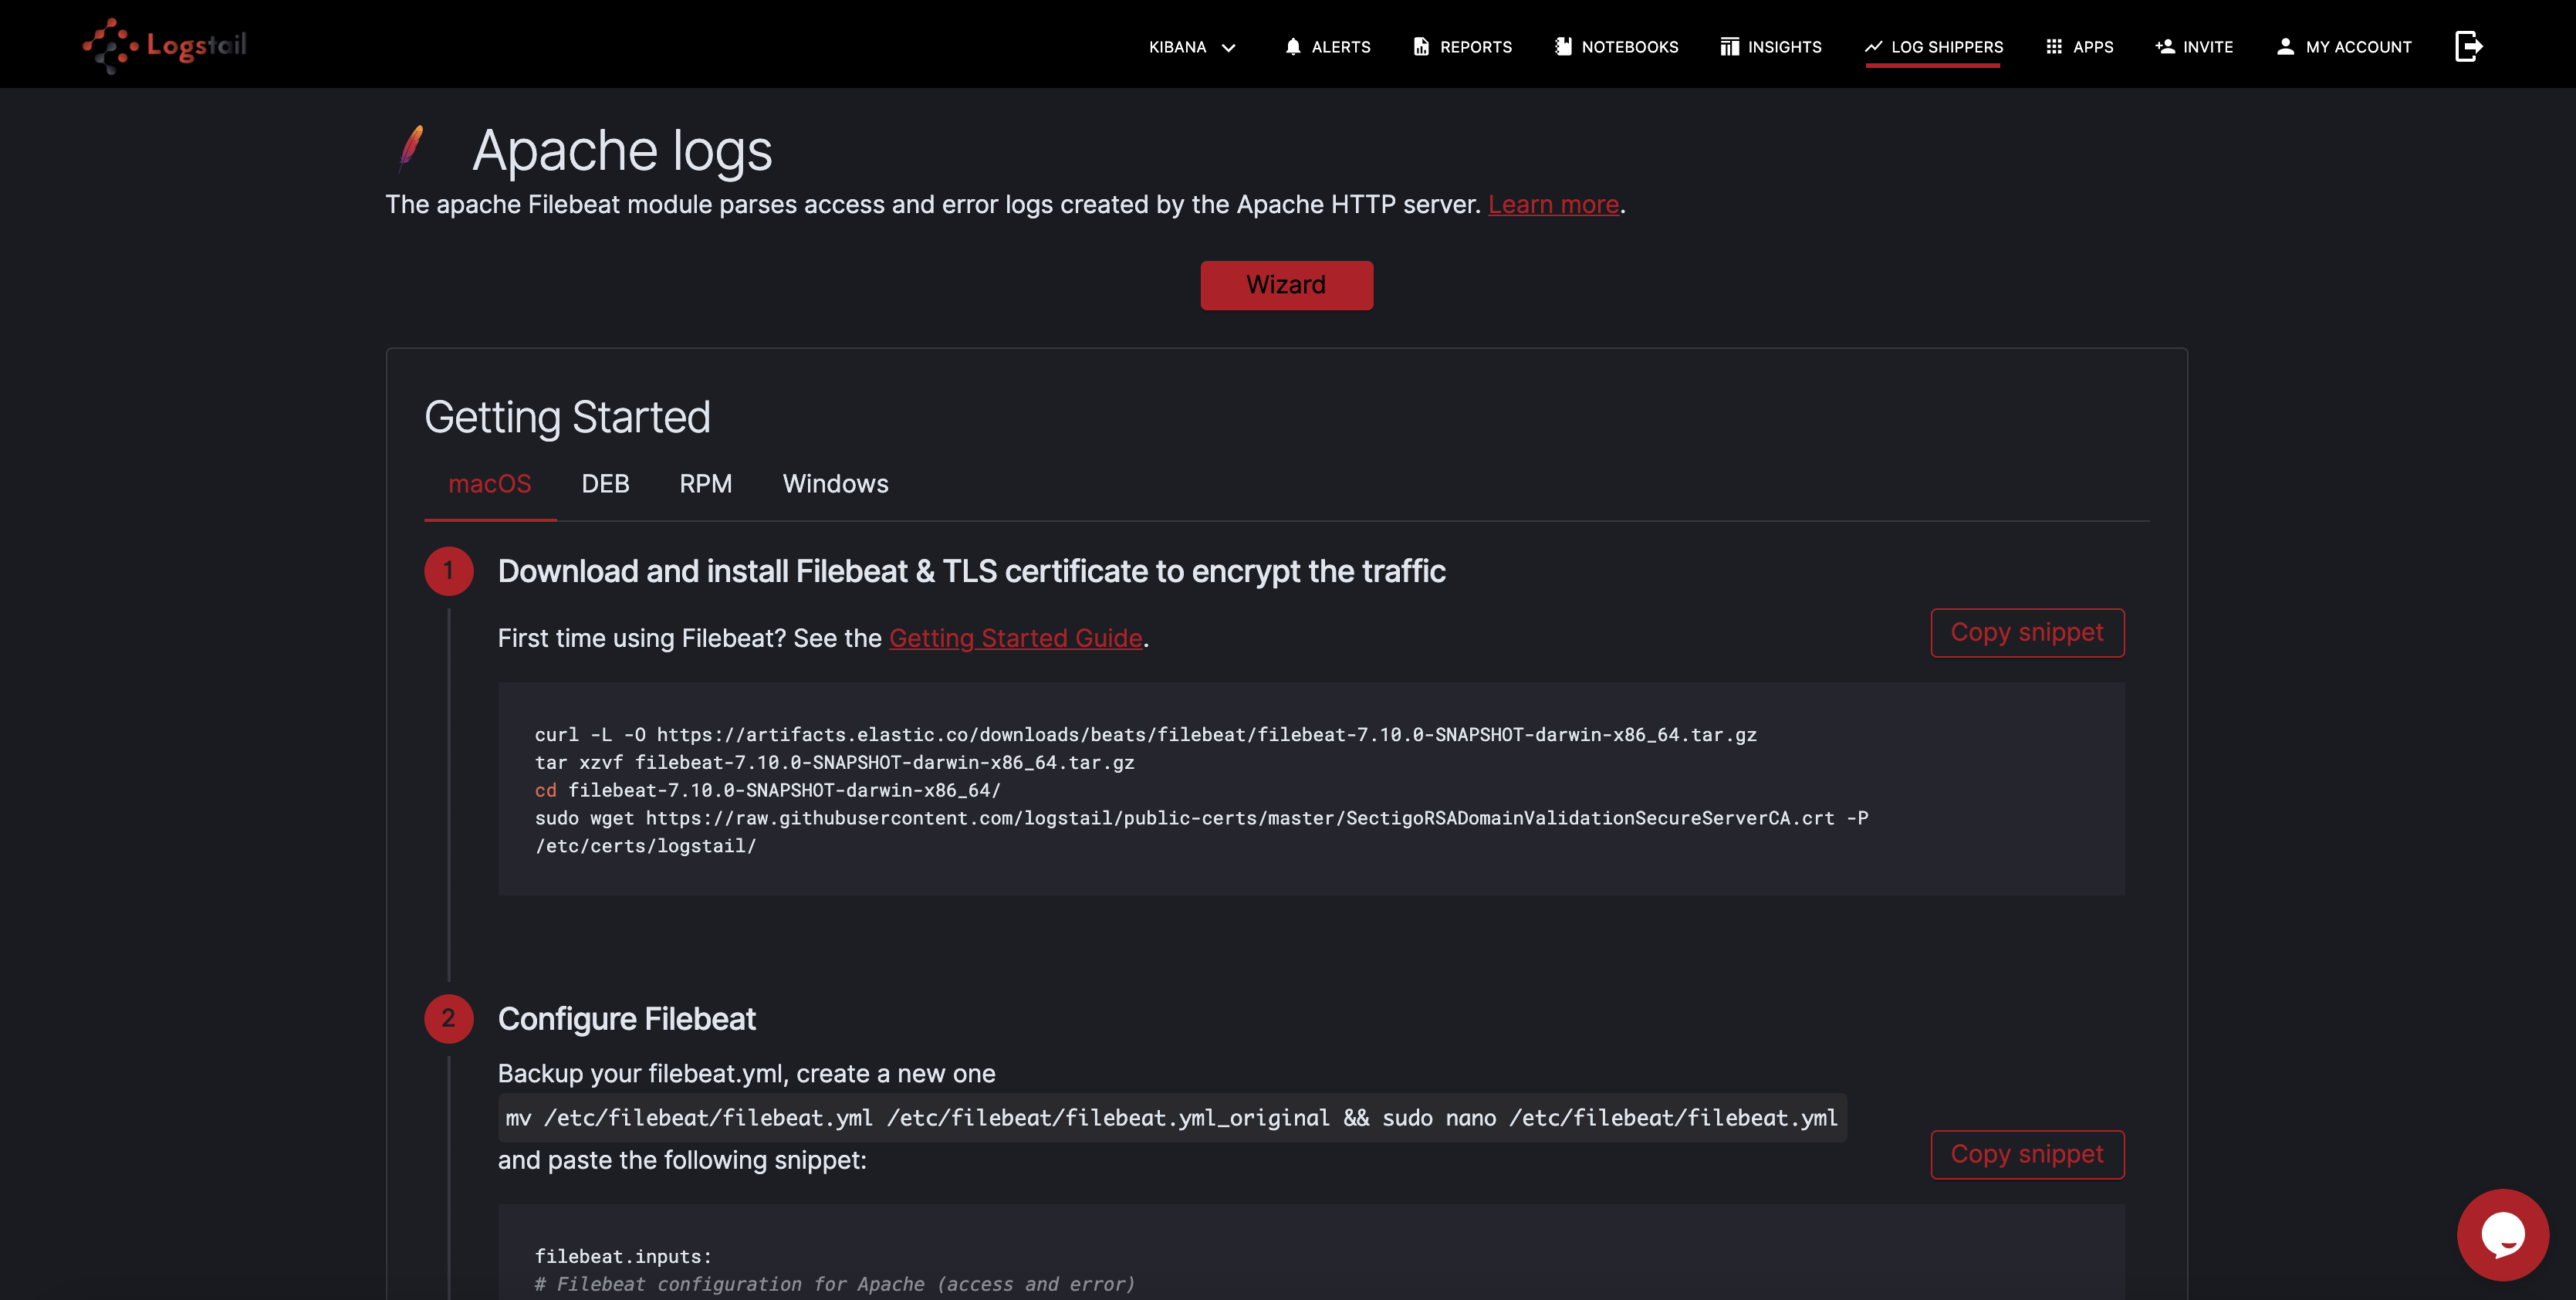
To make things even easier, Logstail.com gives you the opportunity to automatically parse the Apache logs, without the need of Logstash or Filebeat’s Apache module. In order to operationally use your logs, all you have to do is install Filebeat to Apache Server and modify the Filebeat.yml configuration file on your Logstail.com:
1) Download the SSL certificate
Firstly, to secure ship your logs to Logstail.com (encrypted), you have to download the public SSL certificate:
demo@debian:~$ wget https://raw.githubusercontent.com/logstail/public-certs/master/SectigoRSADomainValidationSecureServerCA.crt -P /etc/certs/logstail/
2) Editing Filebeat
Open the Filebeat.yml configuration file with your favorite editor (vim or nano):
sudo vim /etc/filebeat/filebeat.yml
Paste the following configuration (for Debian, taken from shippers page):
filebeat:
prospectors:
- type: log
paths:
- /var/log/apache2/access.log*
- /var/log/apache2/other_vhosts_access.log*
- /var/log/httpd/access_log*
exclude_files: [".gz$"]
fields:
codec: plain
token: USER_TOKEN
type: apache_access
fields_under_root: true
- type: log
paths:
- /var/log/apache2/error.log*
- /var/log/httpd/error_log*
exclude_files: [".gz$"]
fields:
codec: plain
token: USER_TOKEN
type: apache_error
fields_under_root: true
output.logstash:
hosts: ["apps.logstail.com:35723"]
ssl.certificate_authorities: ["/etc/certs/logstail/SectigoRSADomainValidationSecureServerCA.crt"]
Where USER_TOKEN your token provided in your account.
Save the file and restart Filebeat with:
sudo service filebeat restart
Finally, check that Apache data is received from your Filebeat
How to analyze Apache logs
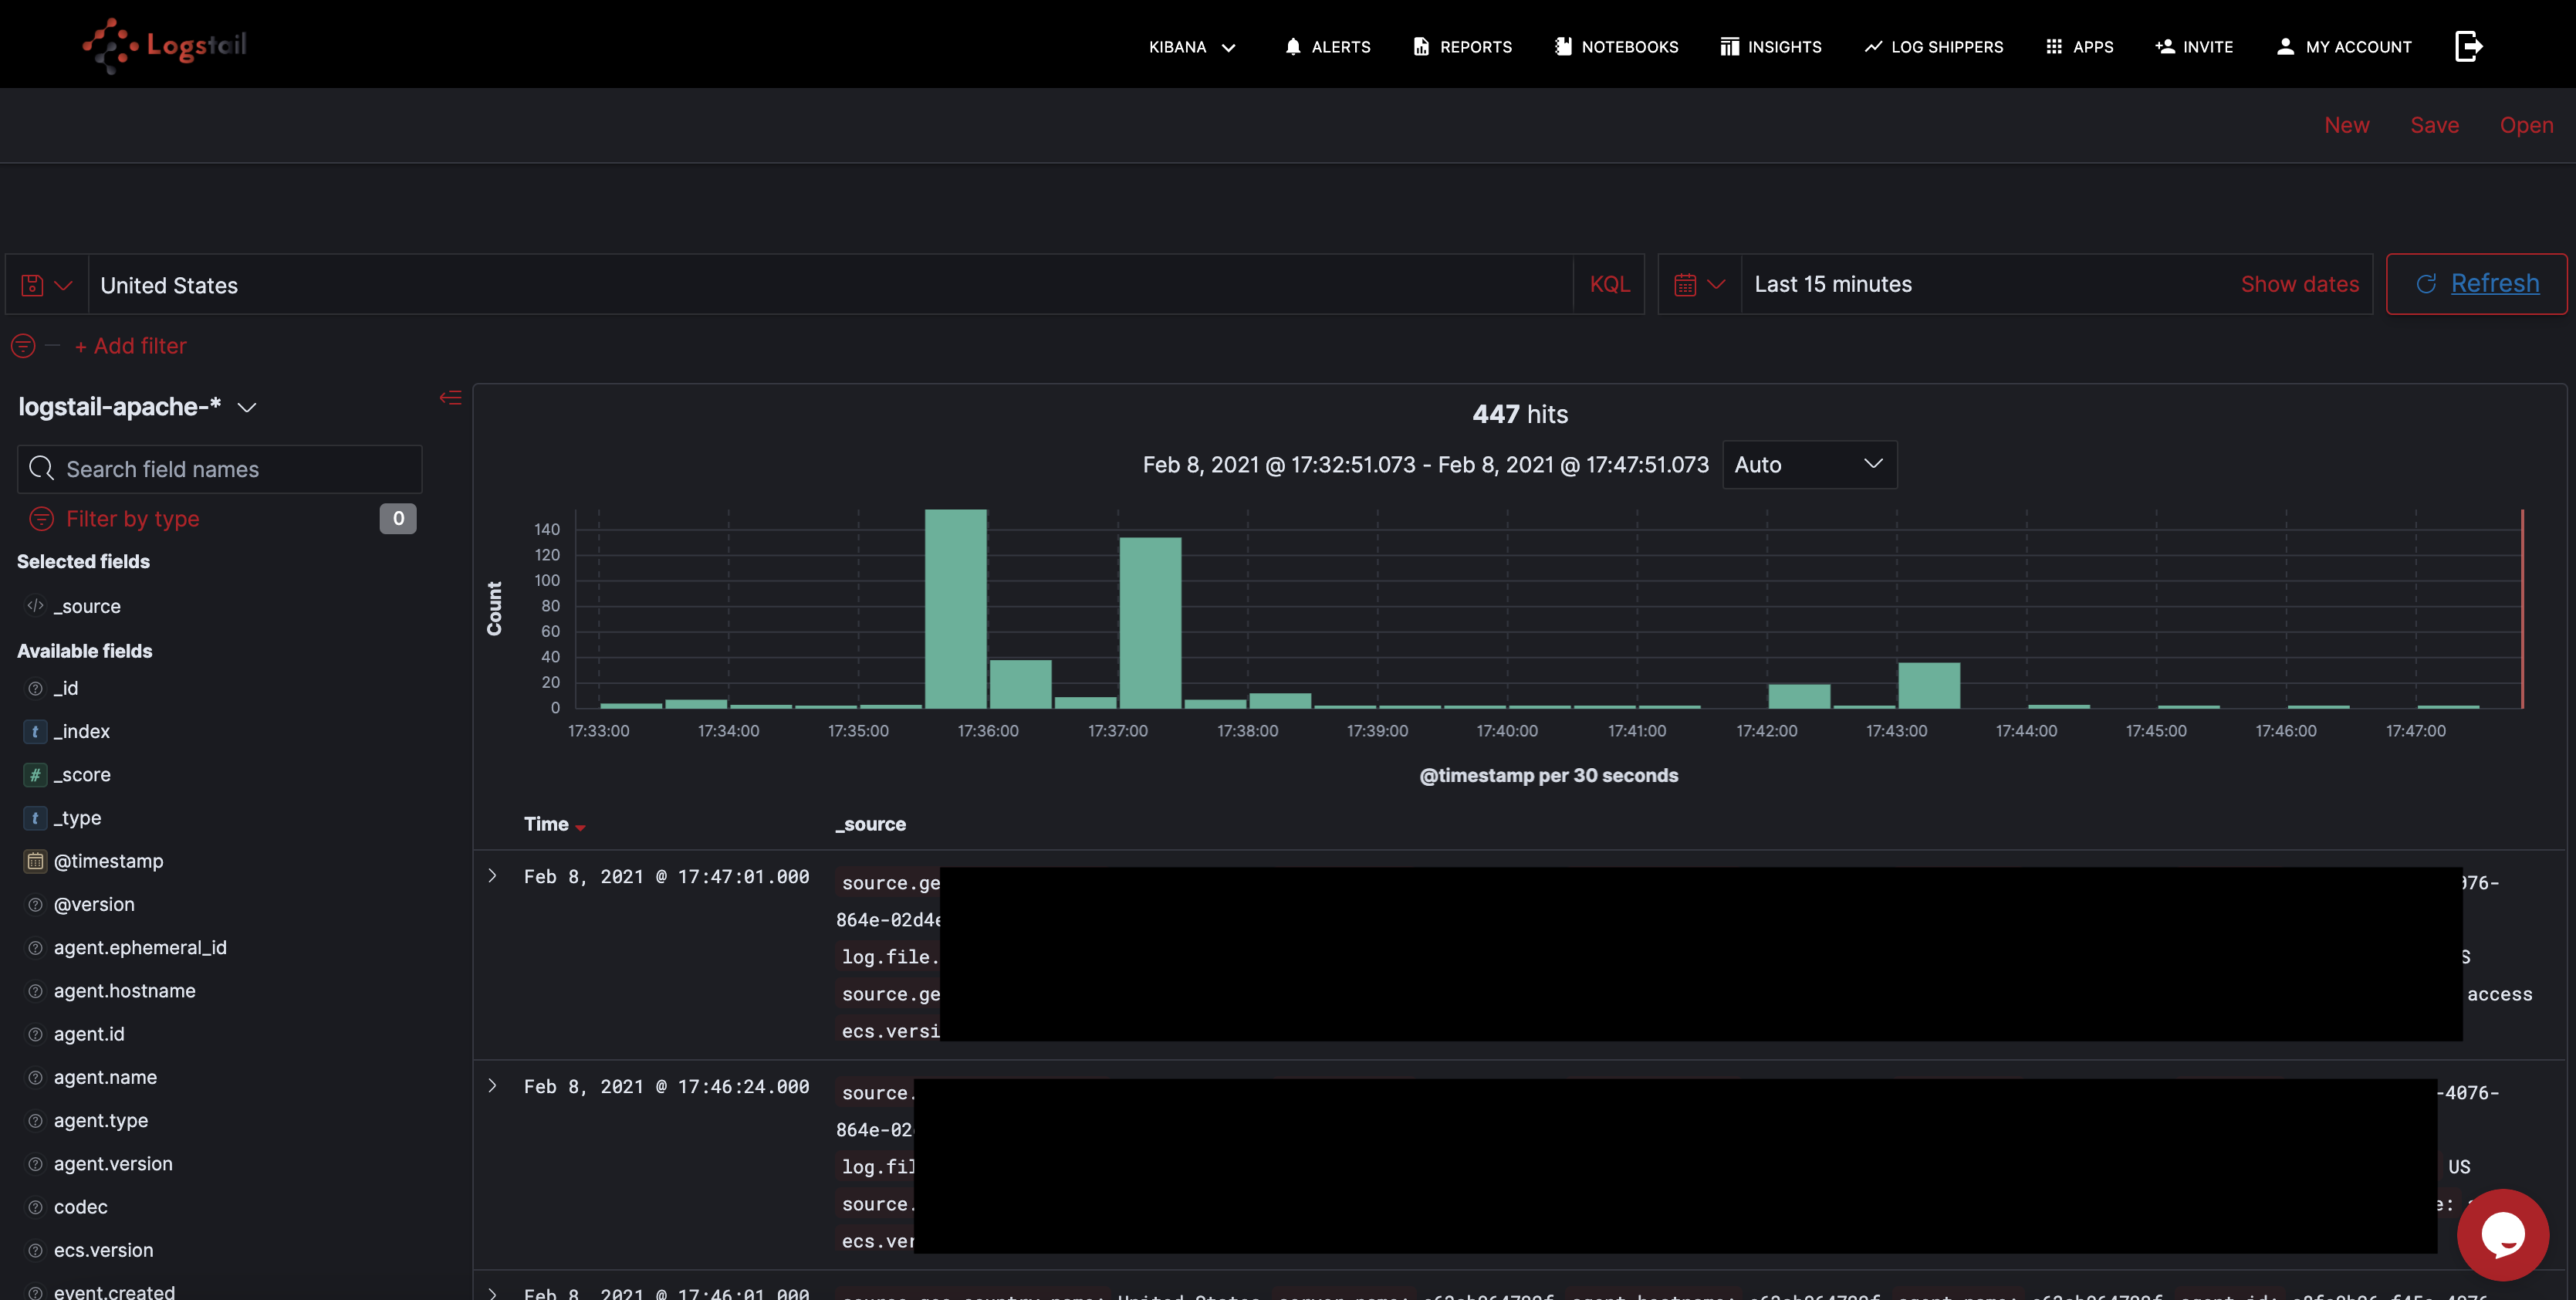
Now you can query your logs with the help of Kibana. Kibana gives you many query options and features like auto-suggest and auto-complete make searching much easier. For example, you can search with free text. Just enter your search query in the search field as follows(search word: United States):
Another option is to conduct field-level searches if you want to be more specific. For example, you can search for any Apache error log for the last day using this search query:
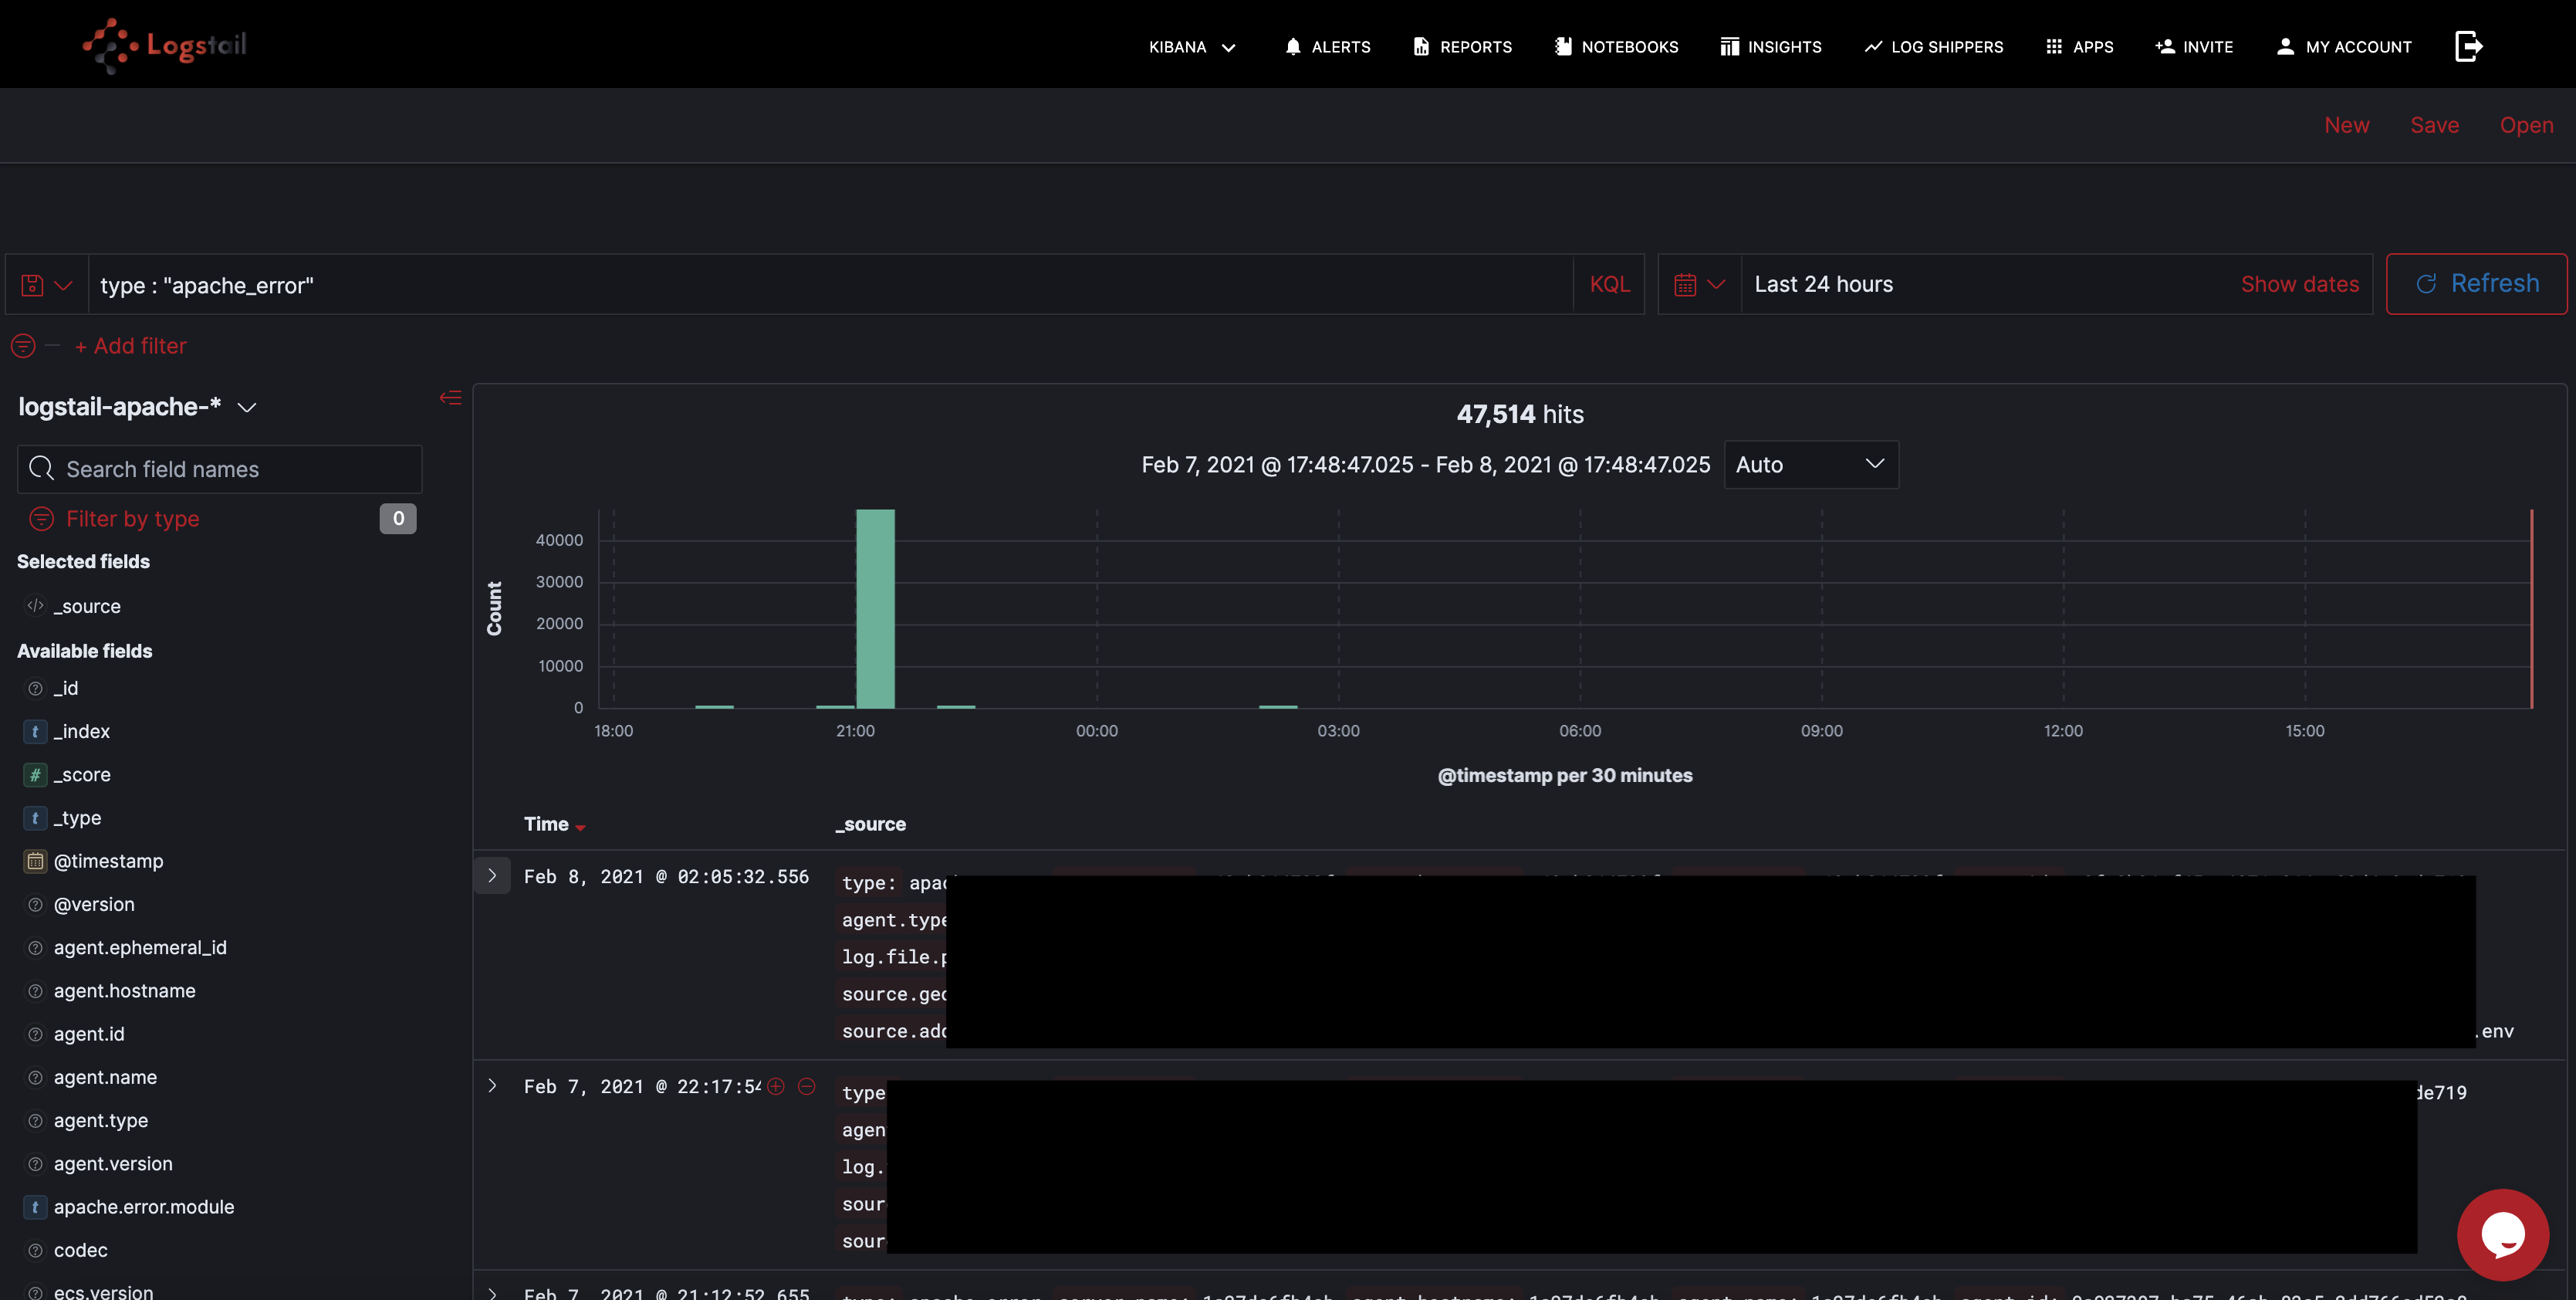
The query options are actually extremely varied depending on your actually needs, which can be analytics, troubleshooting, security and many more
How to visualize them
With Kibana you can instantly visualize your data with dashboards in many different ways. The most frequent uses cases of visualizing Apache logs using Kibana are:
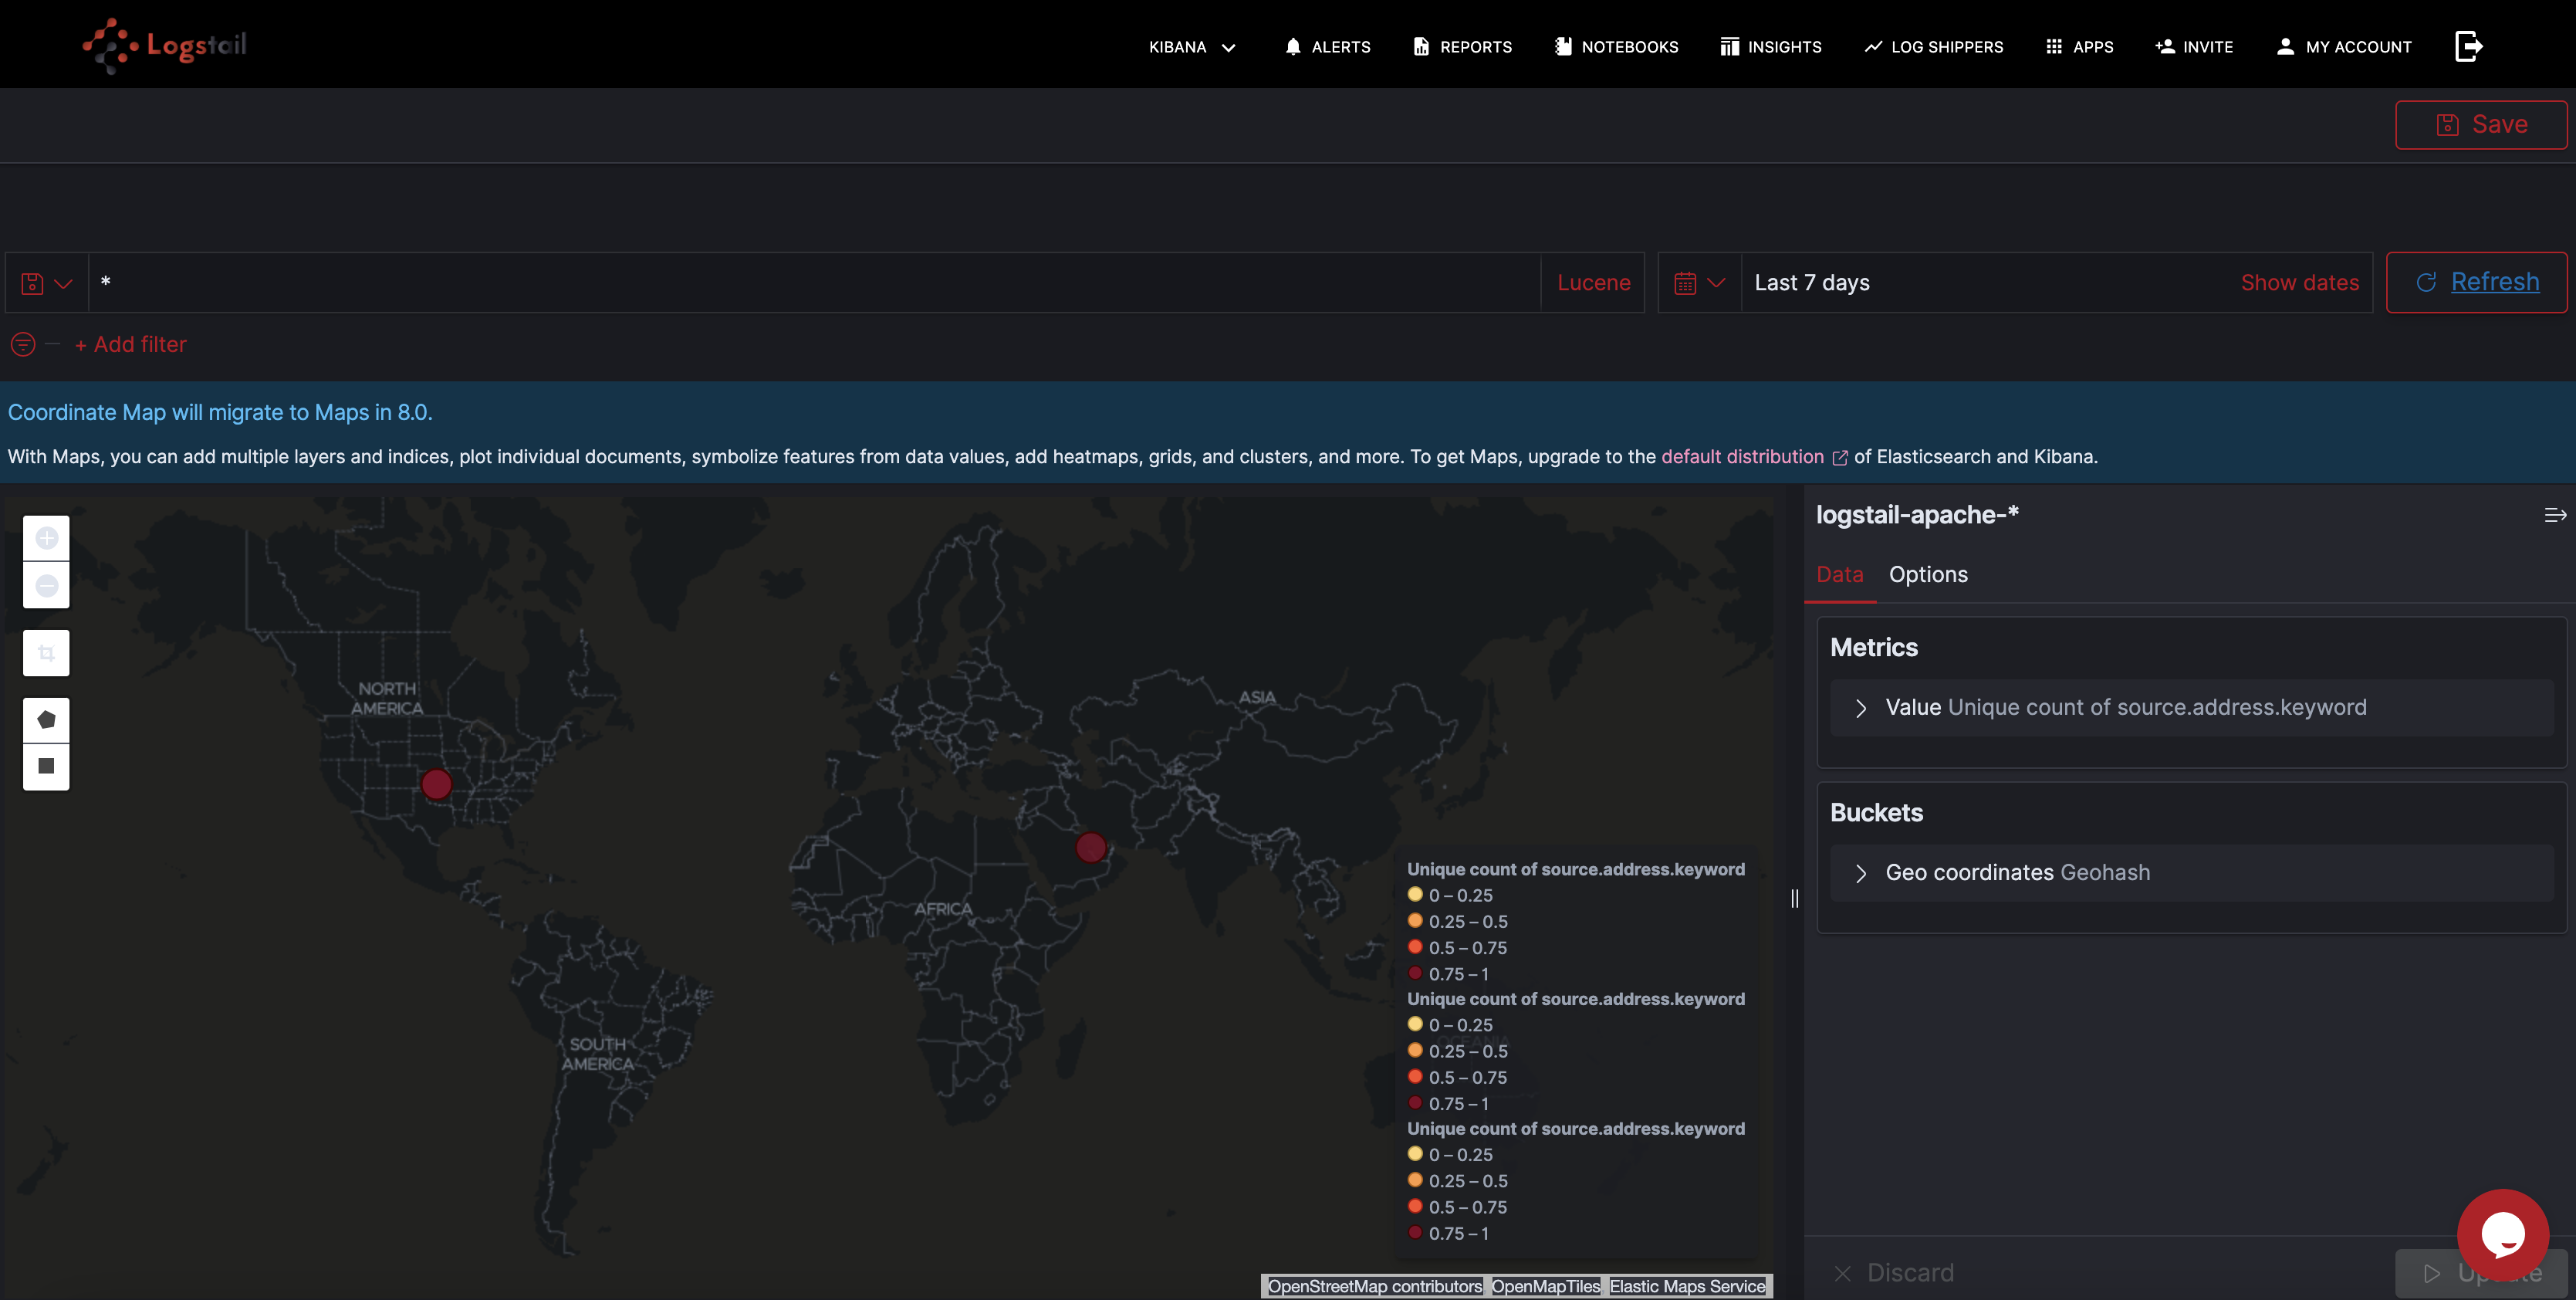
1) Request map
For Apache access logs and any other type of logs recording traffic, the usual place to start is a map of the different locations submitting requests. This helps you monitor regular behavior and identify suspicious traffic. Logstail.com automatically geo enriches the IP fields within the Apache access logs so you can use a Coordinate Map visualization to map the requests as shown below:
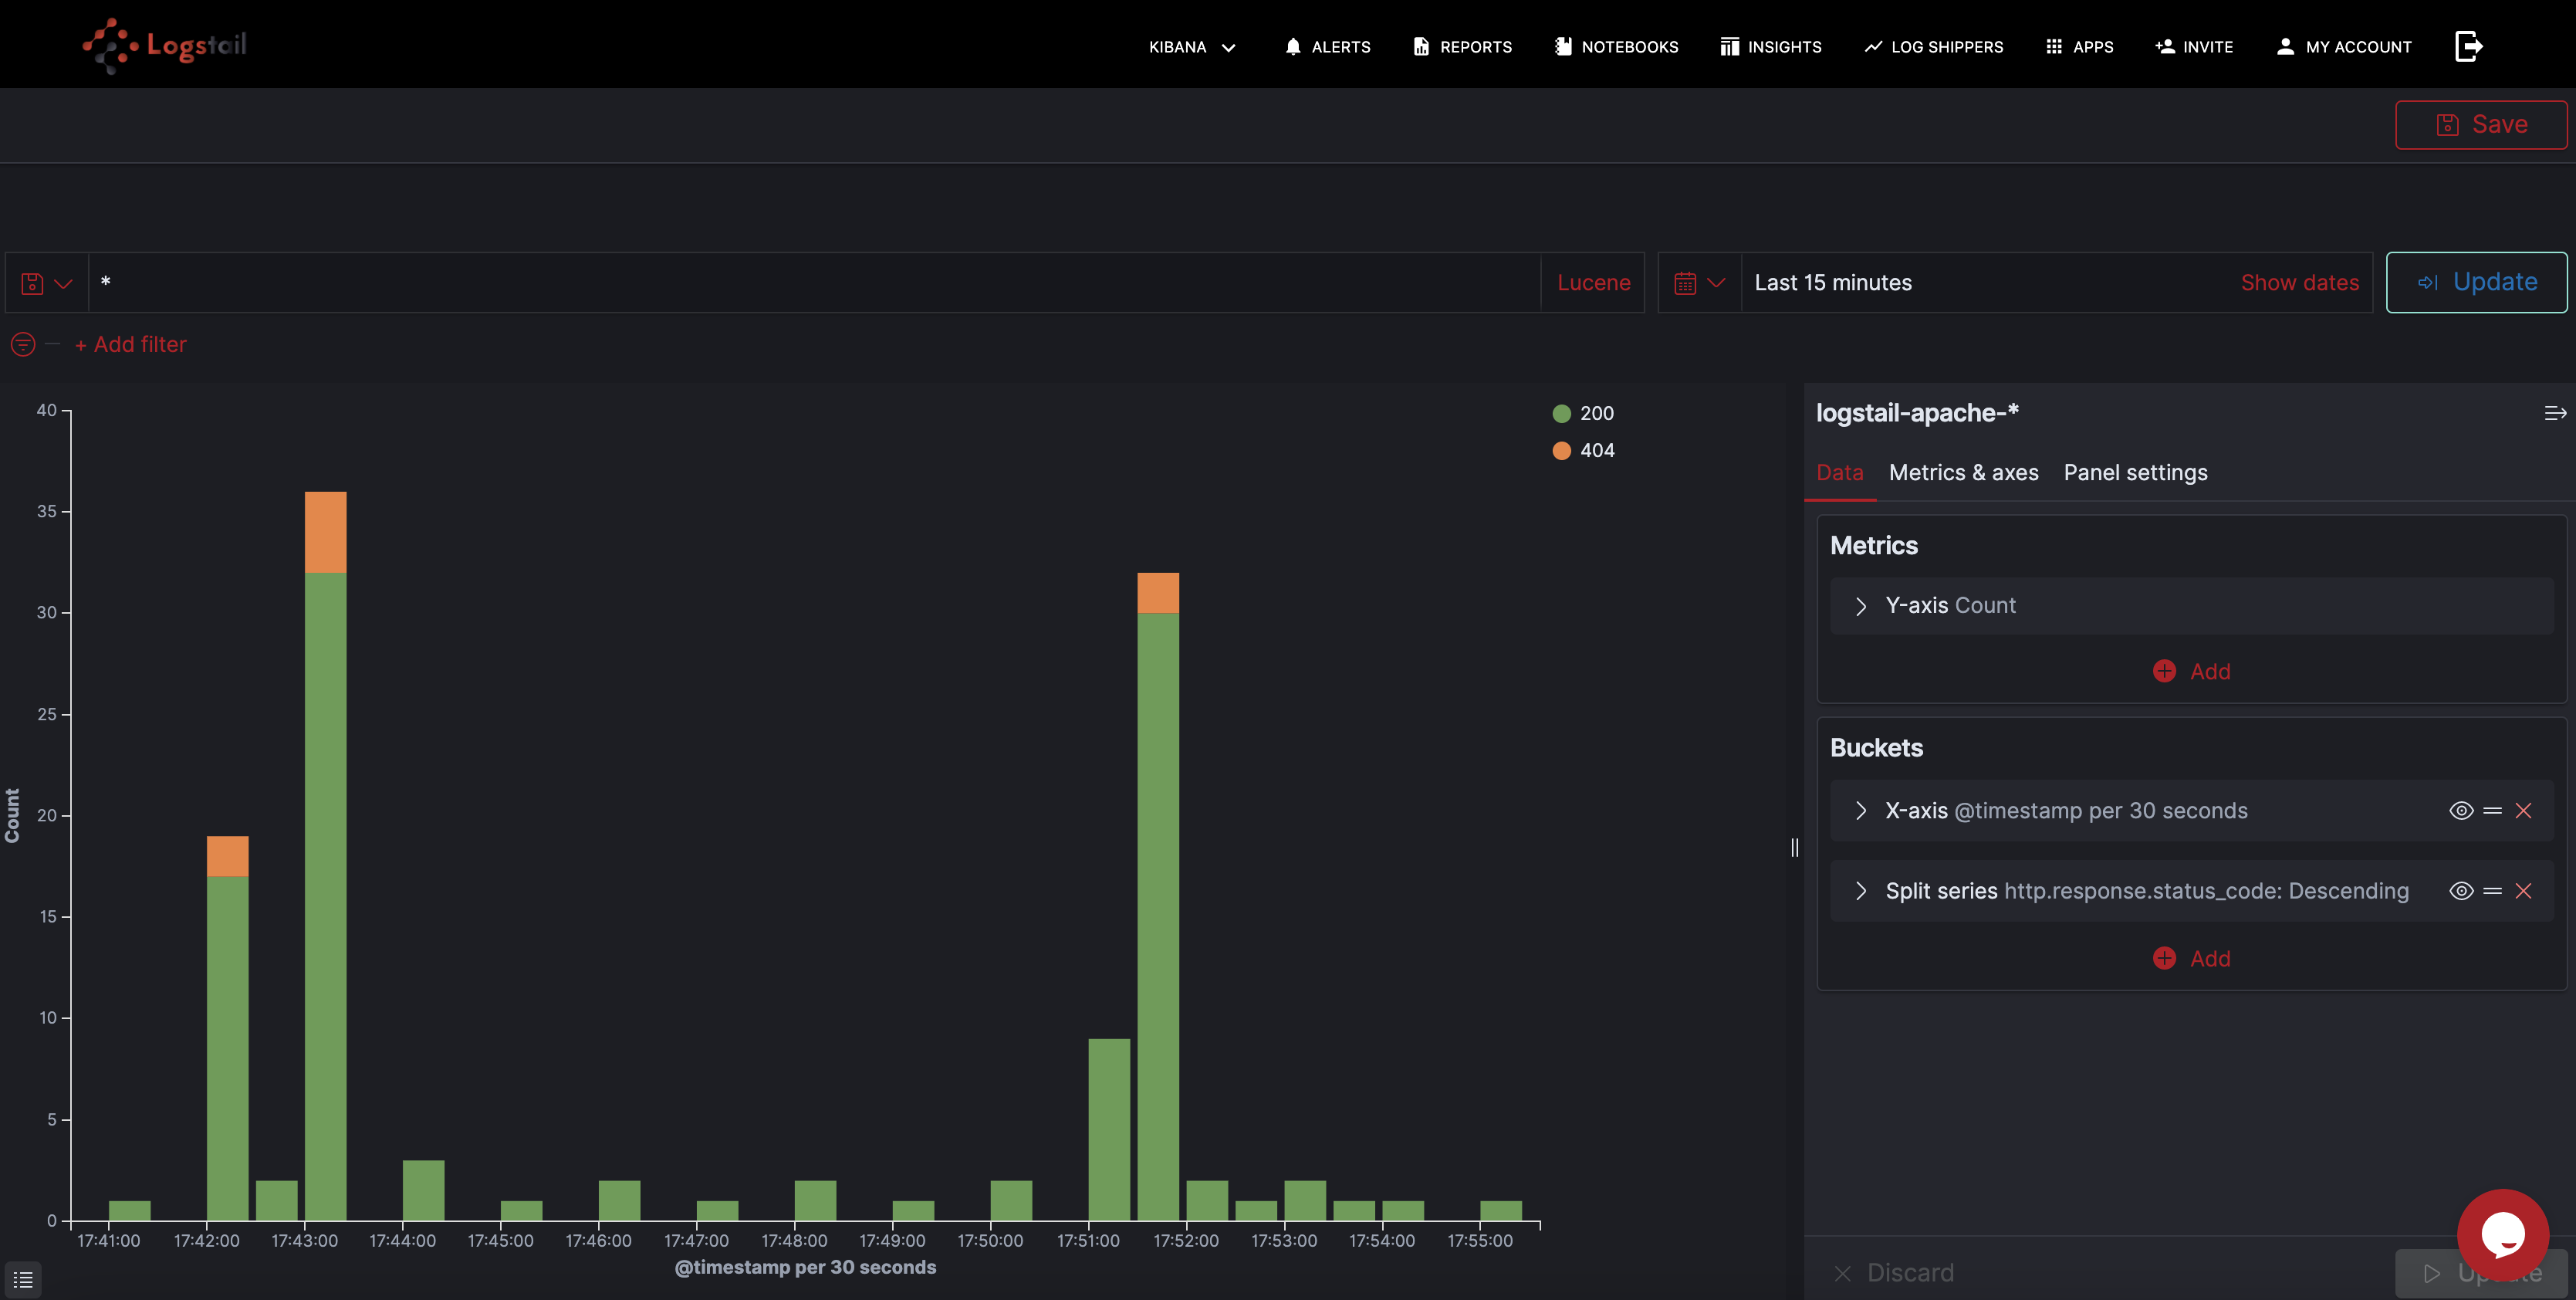
2) Responses over time
Another common visualization used for Apache access logs monitors response codes over time. Again, this gives you a good picture of normal behavior and can help you detect a sudden spike in error response codes. You can use Bar Chart, Line Chart or Area Chart visualizations for this:
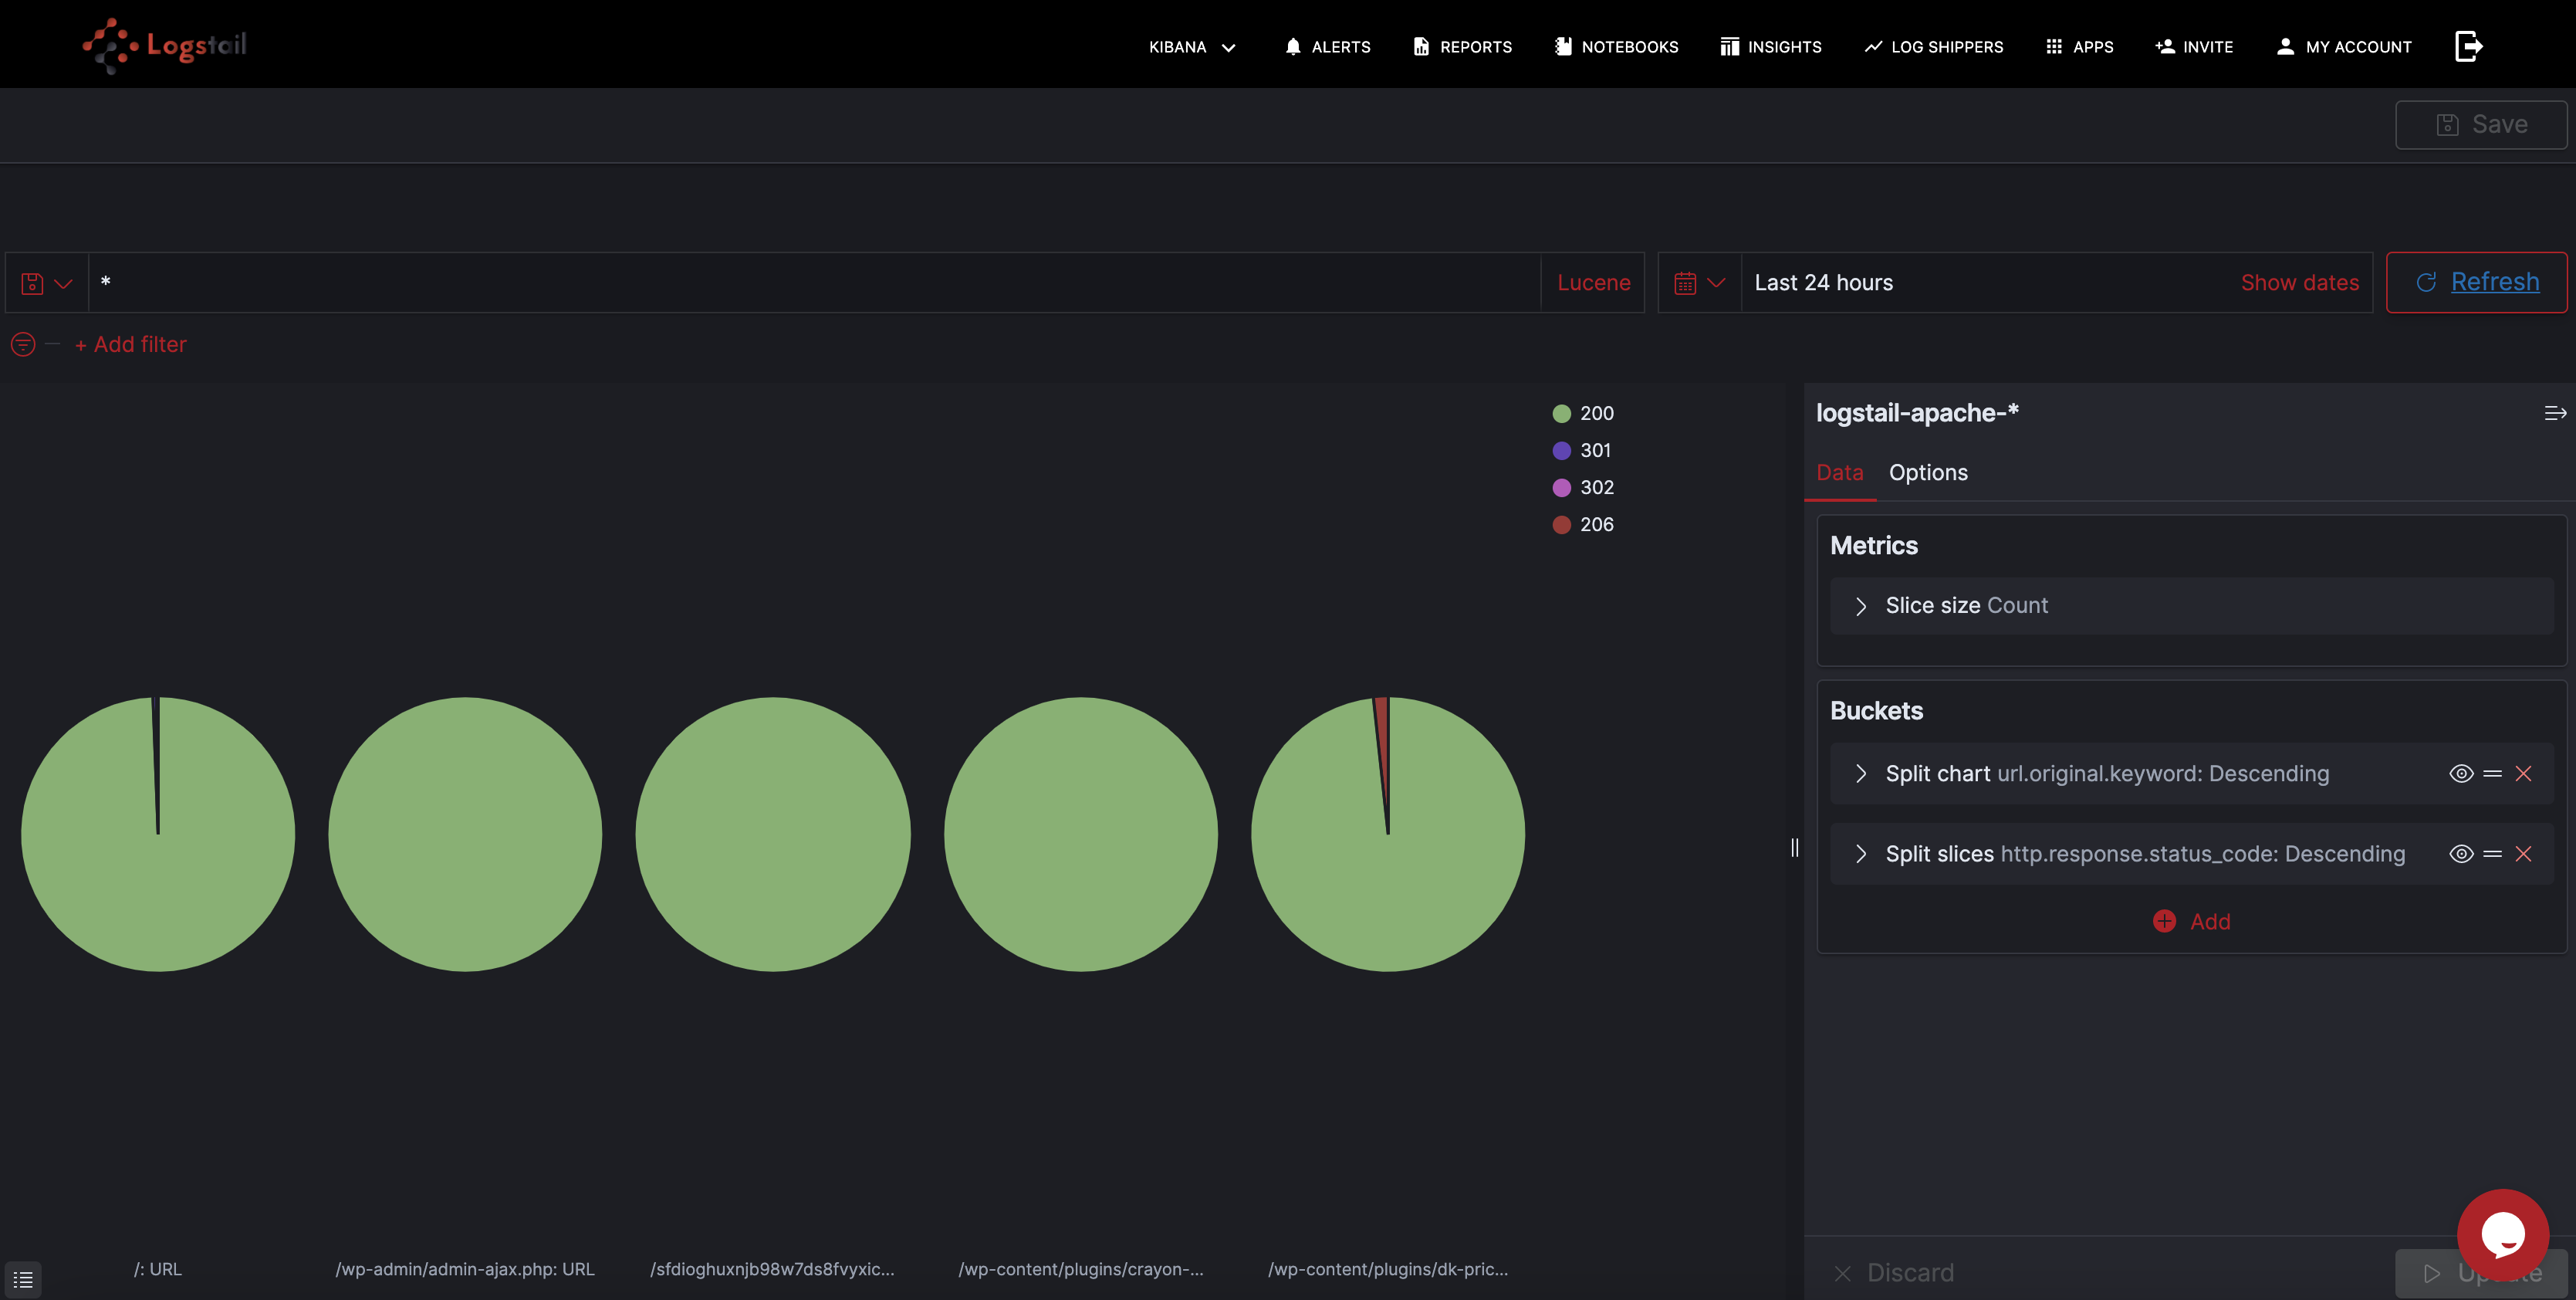
3) Top URL by response code
Data table visualizations are a great way of breaking up your logs into ordered lists, sorted in the way you want them to be using aggregations. In the example here, you can see at the top URL’s by response code sent to your Apache HTTP server:
4) Errors over time
The Apache HTTP server error logs give us a simple indication of the number of errors reported by our web server:
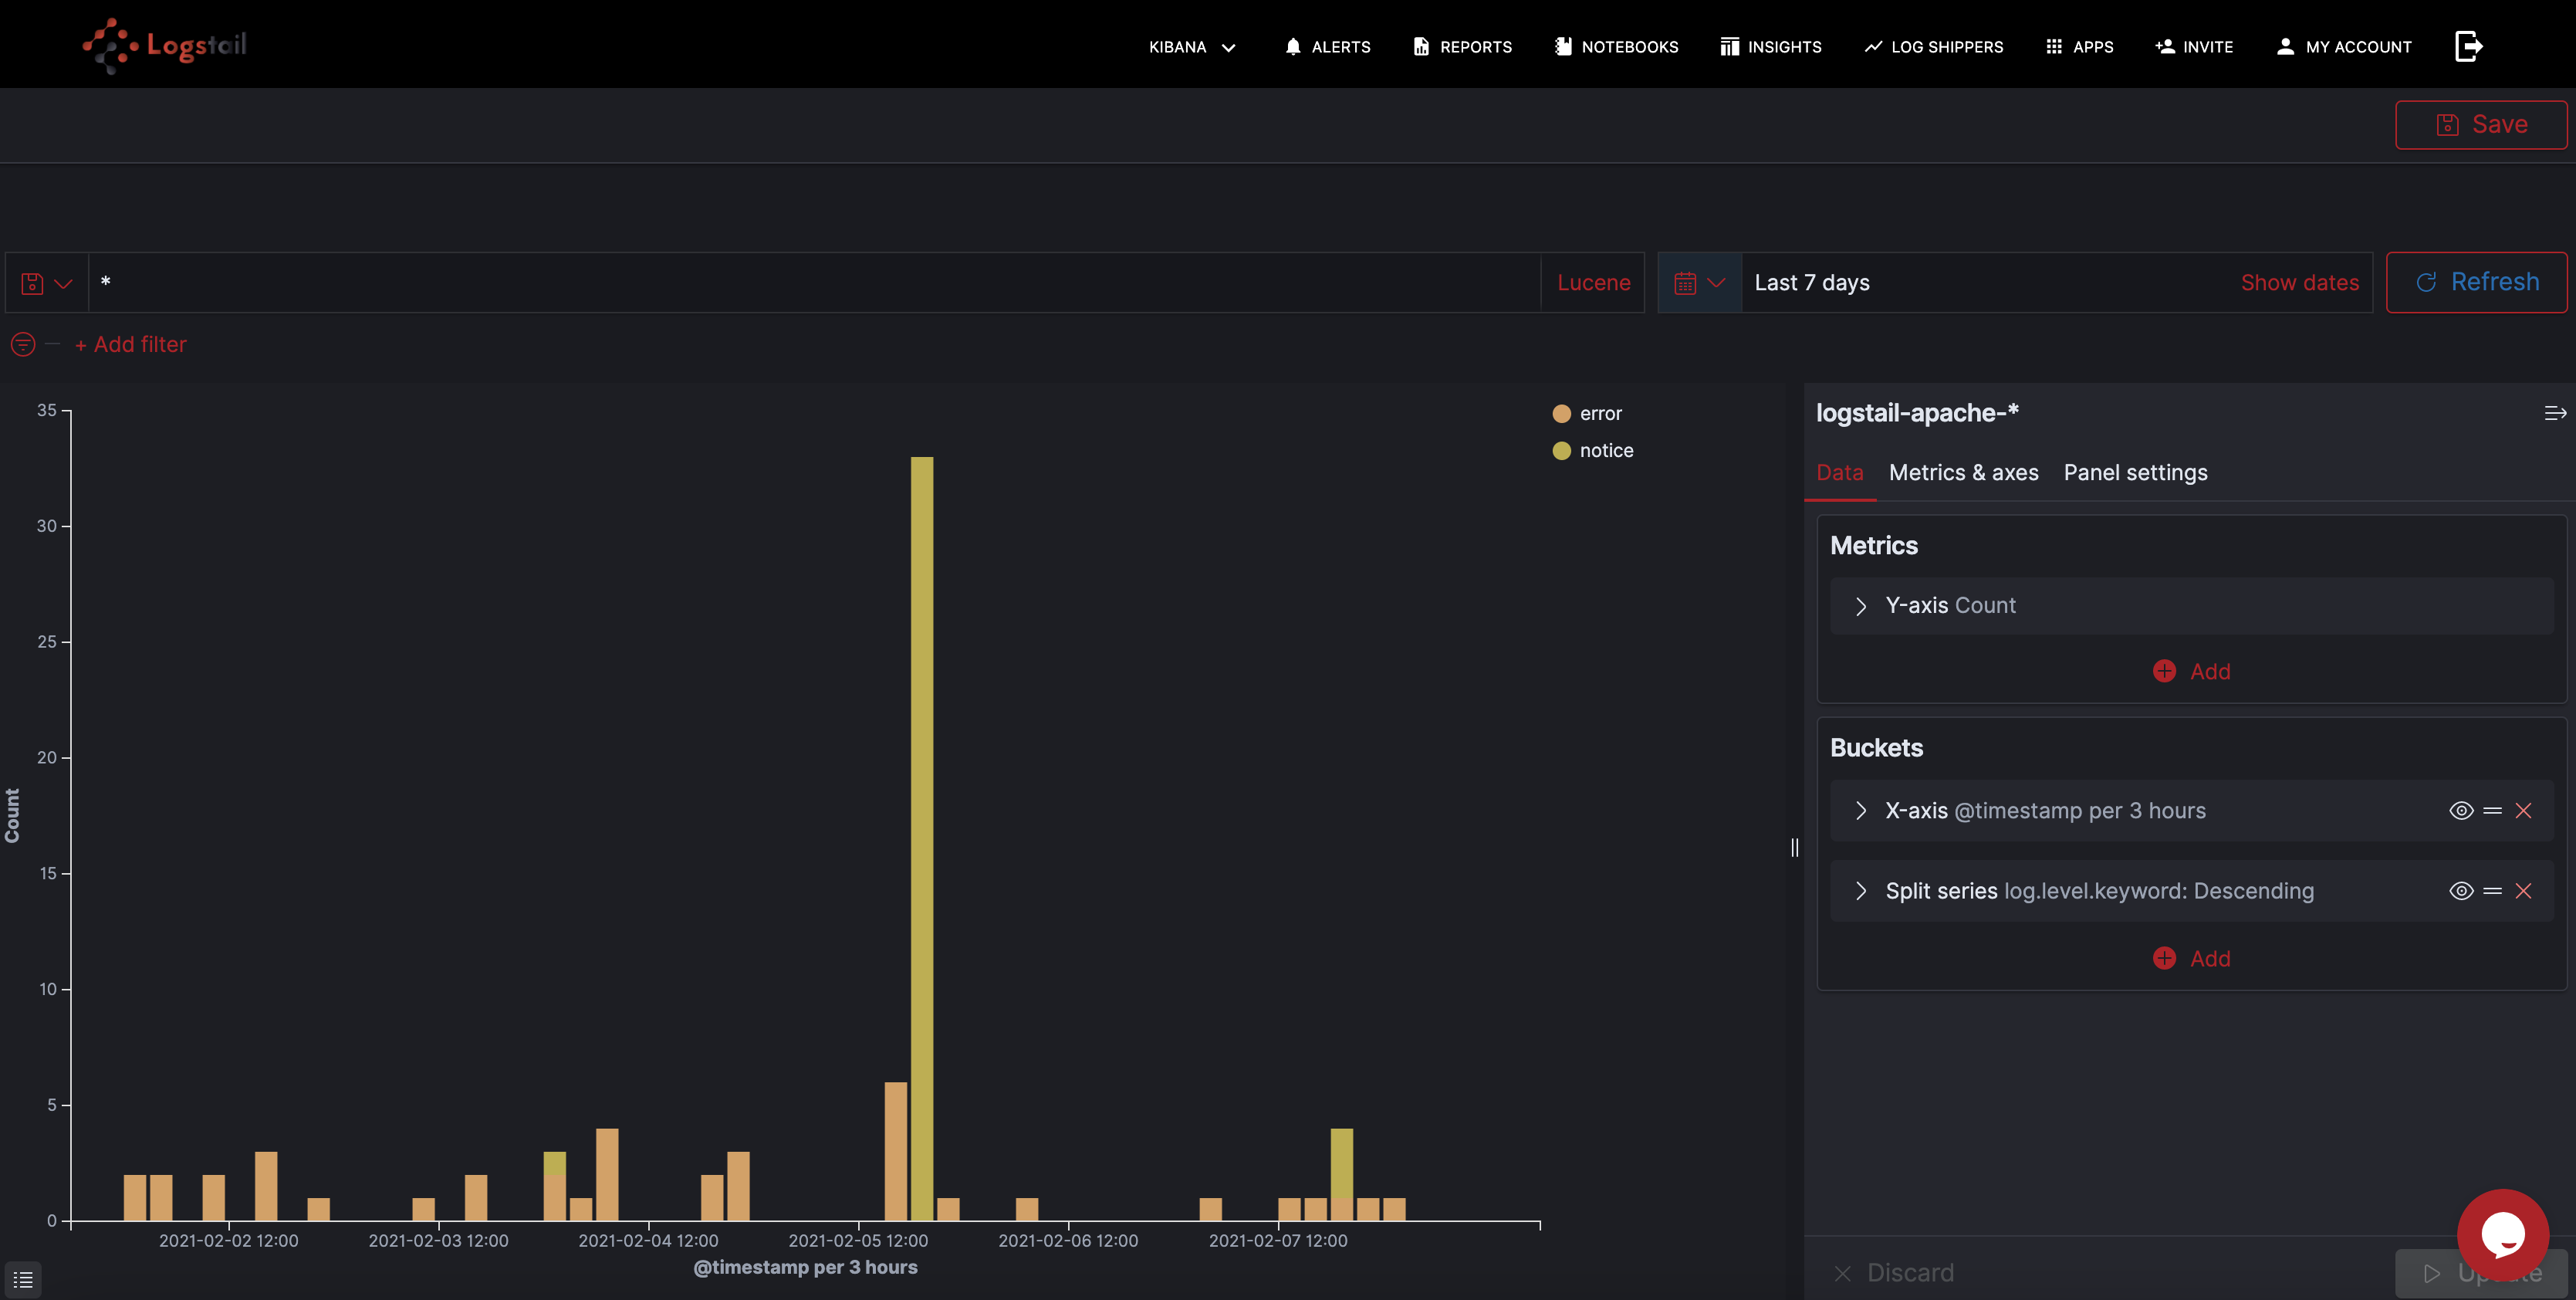
Based on your needs you can customize the visualizations in Kibana, and these were just some simple examples of the tool’s capabilities. The creation of a dashboard is the finishing touch after the visualizations are ready. With a comprehensive dashboard, we have an operational overview of the Apache HTTP server.
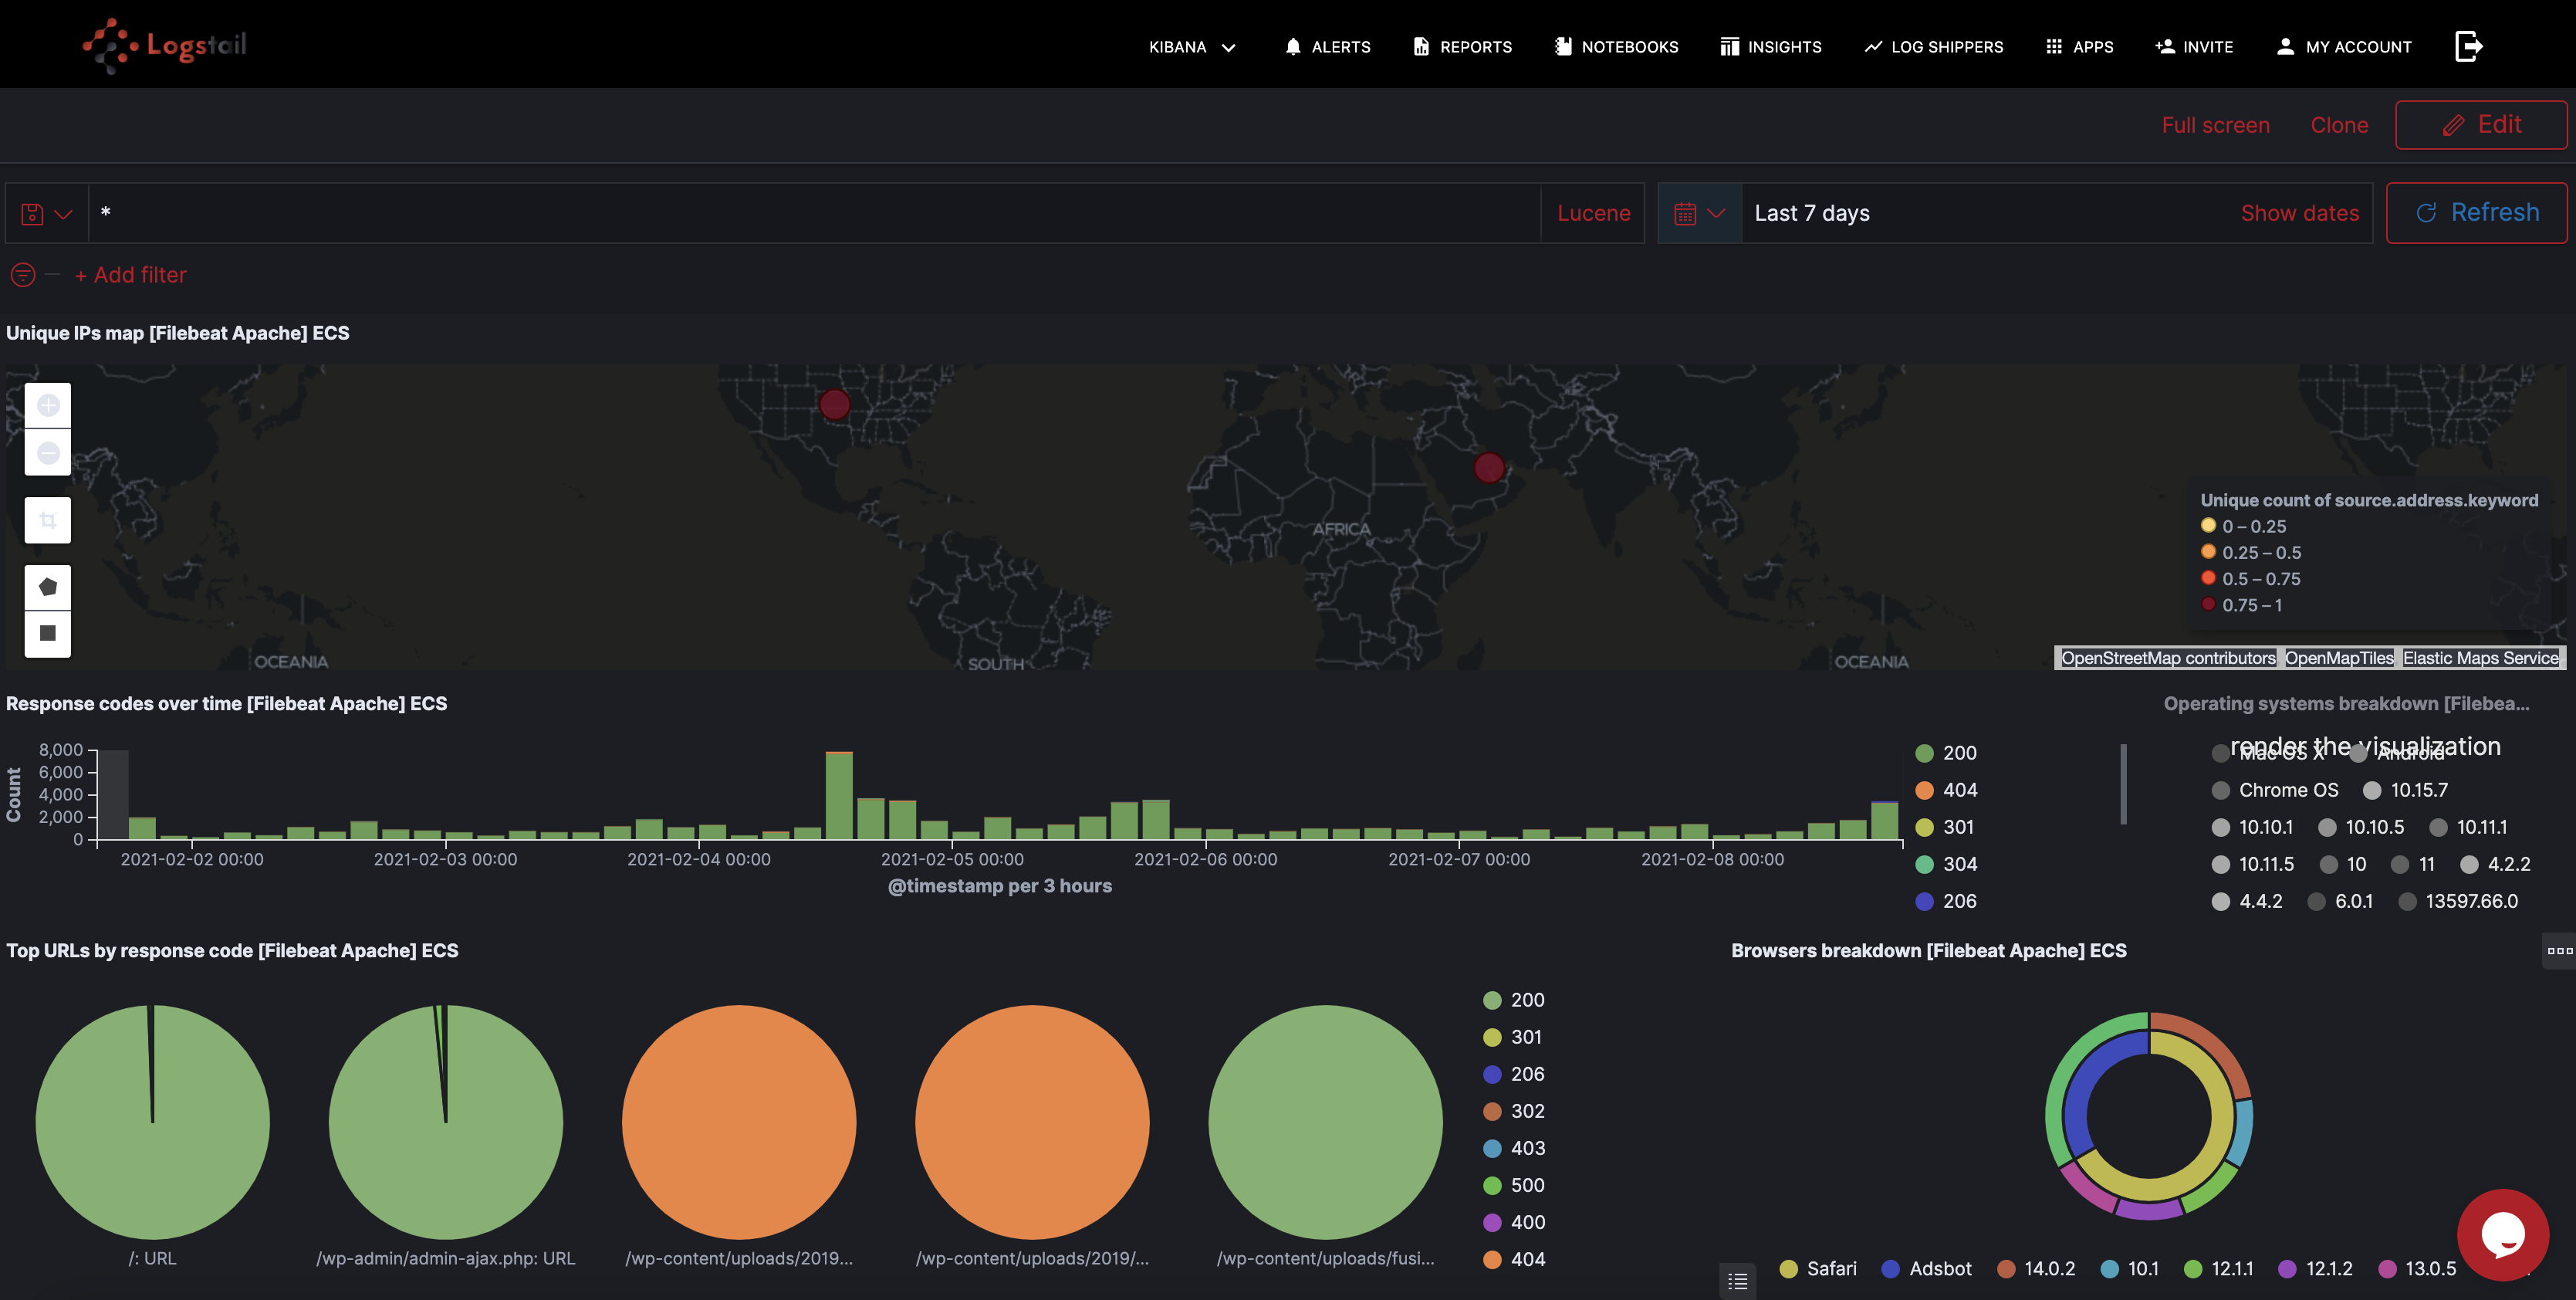
APPS2GO Dashboards
To make things easier we provide Apps2Go which is a library of ready dashboards for Apache. You can configure the time frame for this dashboard from your saved Objects button under Kibana Tab.
Alerting
Alerting is an extremely useful feature provided by Logstail.com. We provide you a mechanism to receive when certain indicators exceed the thresholds been defined. Now you have the ability to immediately realize performance-related or other issues and take the appropriate measures to mitigate the problem. This functionality is a must when you want to have real-time operational awareness of your systems. You can find a thorough article about how our alerting mechanism works, here.
Conclusion
Logstail.com with its advanced features brings the functionality of ELK Stack to your hands. You don’t have to be an engineer in order to set up and use Elasticsearch anymore. Now you can convert your data into actionable insights with just some tweaks. You can maximize the performance of your infrastructure or be notified of potential problems and take the appropriate actions. Sign-up for a free demo in order to realize yourself the power of Logstail.com (https://apps.logstail.com/sign-up/)