
June 29, 2020
Secure WordPress Monitoring
How important is WordPress today?
WordPress today is the most popular Content Management System (CMS) and it also powers 35% of all the websites on the Internet. WordPress is an open-source CMS, which means that anyone can use or modify the WordPress software according to their needs, for free. A CMS is basically a tool that makes it easy to manage the content of your website without needing to know anything about programming. You can create any type of website with WordPress such as business, eCommerce, Social Networks, forums, blogs, and more. The end result is that WordPress makes building a website relatively easy for everyone even people with little or no knowledge about computing.
How secure is WordPress for hosting your activities?
WordPress is currently supported by a large community and is considered to be secure if always up to date. But, we will briefly analyze what we call in security “attack surface” which essentially is the sum of the different points where an unauthorized user can try to enter data to or extract data from WordPress. In security, we try to keep the attack surface as small as possible. WordPress consists of :
- WordPress Core which is developed by the WordPress development team and is considered to fulfill the basic security requirements (despite the fact that occasionally serious vulnerabilities can be found and exploited)
- WordPress Plugins which are pieces of software developed by third-party developers and provided some additional functionality to Core software. Plugins are very likely to have vulnerabilities
- WordPress Themes which is the software to make your site look beautiful, by providing design templates. They are also developed by third-party developers and from a security standpoint, they fall into the same category as Plugins, sometimes posing a serious threat to the overall security of your website. Don’t forget that an attacker needs only one weak point to exploit in order to steal your data or compromise your website.
Apart from the different components that build a WordPress website and the size of the attack surface, there are also some additional attributes that can attract a malicious user. These are:
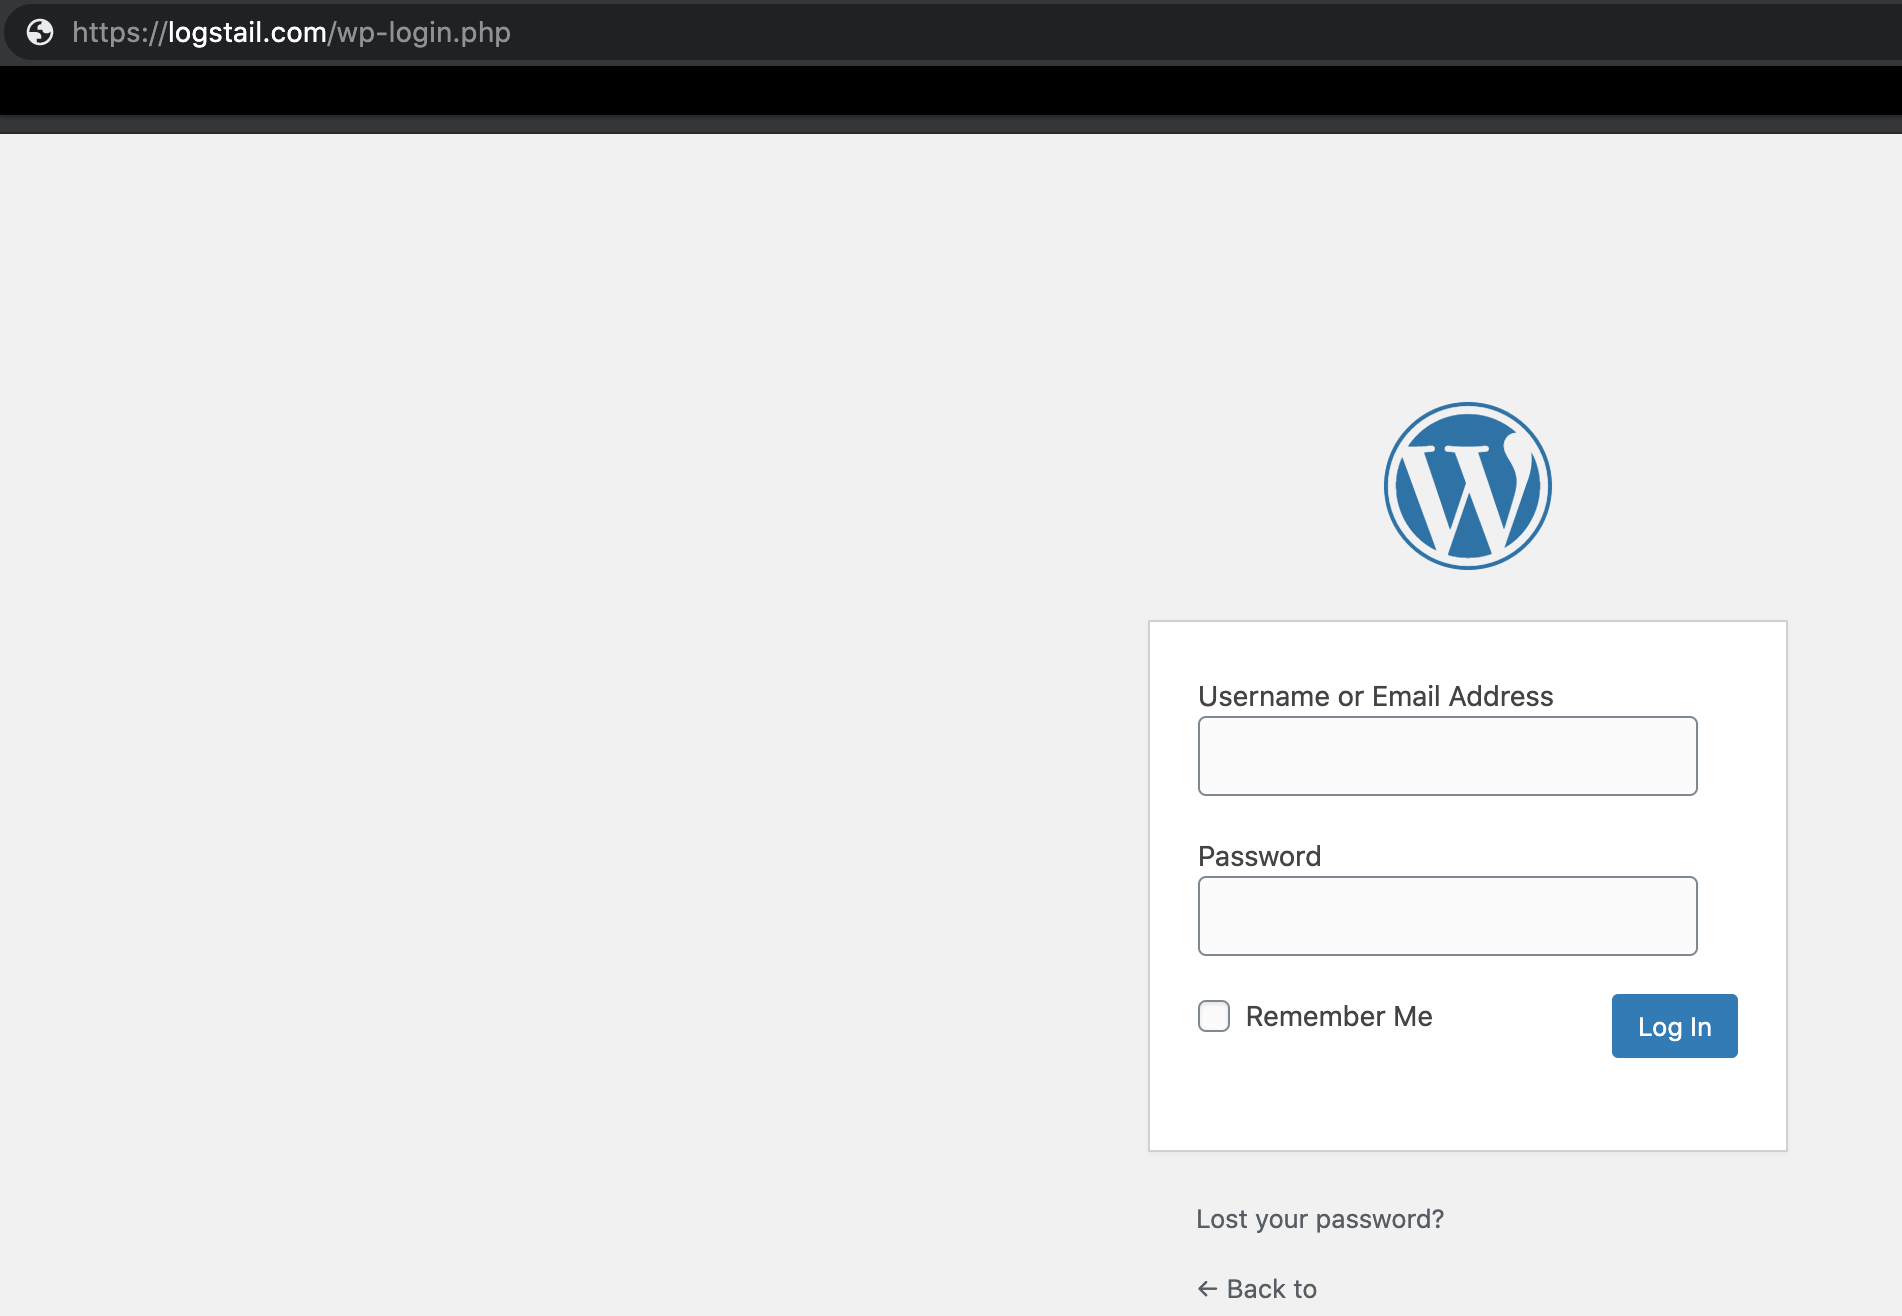
- Possible username enumeration, which is the situation where an attacker can find the users that logging in to your website:
2. Authentication mechanisms such as wp-login.php and XML-RPC which are both prone to a number of attacks like brute force and others:
And of course one of the most important components of an information system is the human factor. Some WordPress users take security seriously and take precautionary measures but others do not give special care because they believe that security is not important and a compromise will never happen to them because their site is not important enough.
In conclusion, the overall security that WordPress provides depends on many factors, and often it is not an easy task to keep track of all these different attack vectors a malicious user can exploit. In any case, a monitoring mechanism is very important to give to an administrator an early warning when something is wrong with the overall performance.
Why do we need monitoring for WordPress?
Monitoring is great for many purposes like identify performance issues, track the location of users that visit our site, and resolve security problems. In this post, we will focus on the last category.
To identify a security issue we must perform what we call a WordPress security audit, which is the process of checking a website for signs of a security breach. A WordPress check can be performed by looking for suspicious activity, malicious code, or an unusual drop in performance. The basic WordPress security contains simple steps that can be done automatically by a security audit tool or manually by manually investigating some basic figures.
When to start looking for suspicious activity?
Security, in general, is a continuous process. That said, we must always be alert and follow the best security practices. However, when we see something suspicious, then we should perform a security check immediately. The following are signs that indicate that something bad happened to our WordPress site.
- The website is slow and sluggish
- There is a drop in website traffic
- We observe suspicious new accounts, forgot password requests, login attempts on our website or see links appear on our website that do not come from us
If we see one or more of the above signs, the best thing to do is to start investigating our website.
- Software updates
WordPress updates are very important for the security and stability of our website. They reduce security vulnerabilities, bring new features, and improve performance. We have to make sure that core software, plugins, and themes are up to date. We can do that by navigating to Dashboard » Updates page inside the WordPress admin area.
-
User accounts and passwords
Also, we need to review WordPress user accounts by navigating to Users » All Users page. We are looking for suspicious user accounts that shouldn’t be there apart from us or any other user that we have manually added. If we see suspicious user accounts, we have to delete them. We do not forget that a good security practice is to change our WordPress admin password with a strong one. Finally, enabling two-factor authentication is an excellent security practice for the administration of our website.
-
Website analytics
Website analytics give answers about visitors, but they also give an indicator of our website’s health. There is a possibility that our website has been blacklisted by search engines for some security reasons. On this occasion, we will see a sudden drop in our website’s traffic.
Log files monitoring for our WordPress site
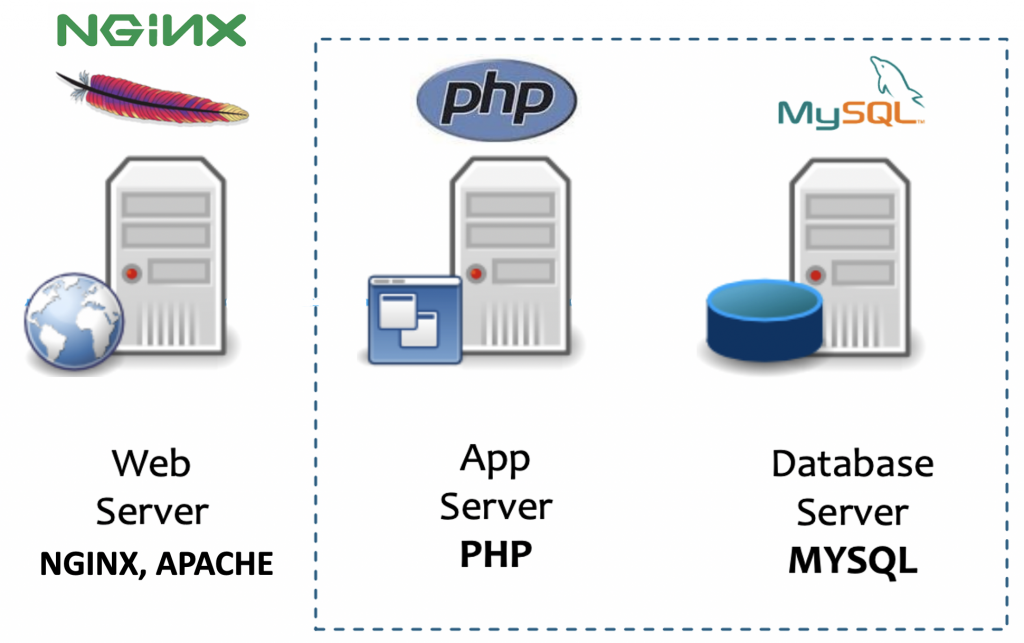
The next thing to do is to check the log files related to our WordPress activity. Generally, the two main components of WordPress are the App Server in PHP and the Database Server in MySQL. A Web Server like Apache or Nginx serves the purpose of providing the interface for the users to interact with the WordPress infrastructure. The most important logs we have to monitor for security purposes are:
- Web Server Logs (Apache, Nginx)
- Application Server Logs (PHP)
- Database Server Logs (MySQL)
- WordPress Logs
Web Server Logs (Apache, Nginx)
Initially, we have to monitor the web server logs because WordPress is written in PHP so it is typically hosted on Apache or Nginx web server. There is also the capability to be hosted on Microsoft’s IIS web server but it is not so common. Both Apache and Nginx web servers have two log files that are of interest to us, the access logs and the error logs.
The access logs store all the requests processed by the Apache or Nginx server and are used for performance monitoring. Additionally, they can be used for resolving security issues. They contain a lot of valuable information about the requests to Apache (which pages people are viewing, the success status of requests, and how long the request took to respond).
The error logs store diagnostic information and any error encountered while processing the requests. They are mostly used for operational monitoring and troubleshooting because they contain diagnostic information and errors logged while processing requests.
In relation to a WordPress site, the web server error log file can provide useful information when there is a HTTP 500 Internal Server Error, a file permissions problem, or an issue with a plugin.
Please look at those two extensive articles for both Apache and Nginx Monitoring with Logstail.com.
Application Server Logs (PHP)
PHP keeps a record of all the errors that occur when running your WordPress site in a log file. If PHP is running as a module on Apache, most probably the PHP errors will be logged in the web server’s error log file, resulting in both Apache and PHP writing to the same file.
The PHP error log file usually is used by developers when developing a WordPress plugin or theme and it useful for them because they can find a record of all the errors that occurred while the application was being executed, in order to help them fix any issues.
But also as a WordPress user or administrator, you might need to refer to them since you will find useful information when running a particular plugin or theme that causes issues.
Database Server Logs (MySQL)
MySQL is the most popular open-source relational database management system (RDBMS). It is a free software under the terms of the GNU General Public License and is also available under a variety of proprietary licenses.
The error log contains a record of mysqld startup and shutdown times. It also contains diagnostic messages such as errors, warnings, and notes that occur during server startup and shutdown, and while the server is running. For example, if mysqld notices that a table needs to be automatically checked or repaired, it writes a message to the error log. The general query log is a general record of what mysqld is doing. The server writes information to this log when clients connect or disconnect, and it logs each SQL statement received from clients. The general query log can be very useful when you suspect an error in a client and want to know exactly what the client sent to mysqld. By default, the general query log is disabled.
In relation to a WordPress site, the error logs are useful if a user perform searches for something in the WordPress site and the results are incorrect, we use this log file to troubleshoot and potentially find malicious behavior.
Please look at the extensive article for MySQL Monitoring with Logstail.com.
WordPress Logs
WordPress has its own debug log file and by default is disabled. The debug logs are very useful for WordPress developers. It is also valuable for WordPress administrators which can use this file to find information about possible plugins or theme issues they are having on their website.
Steps to ship logs to Logstail.com
With Logstail.com you can automatically parse the Apache, Nginx, PHP and MySQL logs, without the need of Logstash or Filebeat’s modules. In order to operationally use your logs, all you have to do is install Filebeat to the source you want to monitor and modify the Filebeat.yml configuration file on your Logstail.com:
1) Download the SSL certificate
Firstly, to secure ship your logs to Logstail.com (encrypted), you have to download our public SSL certificate and create the appropriate folder:
|
1 |
wget https://raw.githubusercontent.com/logstail/public-certs/master/SectigoRSADomainValidationSecureServerCA.crt -P /etc/certs/logstail/ |
This step is the same for all three sources (Apache, Nginx, MySQL).
2) Editing Filebeat
The second step is to backup the original filebeat.yml and create a new one with the following command :
|
1 |
mv /etc/filebeat/filebeat.yml /etc/filebeat/filebeat.yml_original && sudo nano /etc/filebeat/filebeat.yml |
and paste the appropriate configuration to the new file which you can find in shippers page.
3) Restart Filebeat
Next, save the file and restart Filebeat with:
|
1 |
sudo service filebeat restart |
4) Data check
Finally, check that data is received from your Filebeat to your Logstail Kibana dashboard.
How to analyze logs
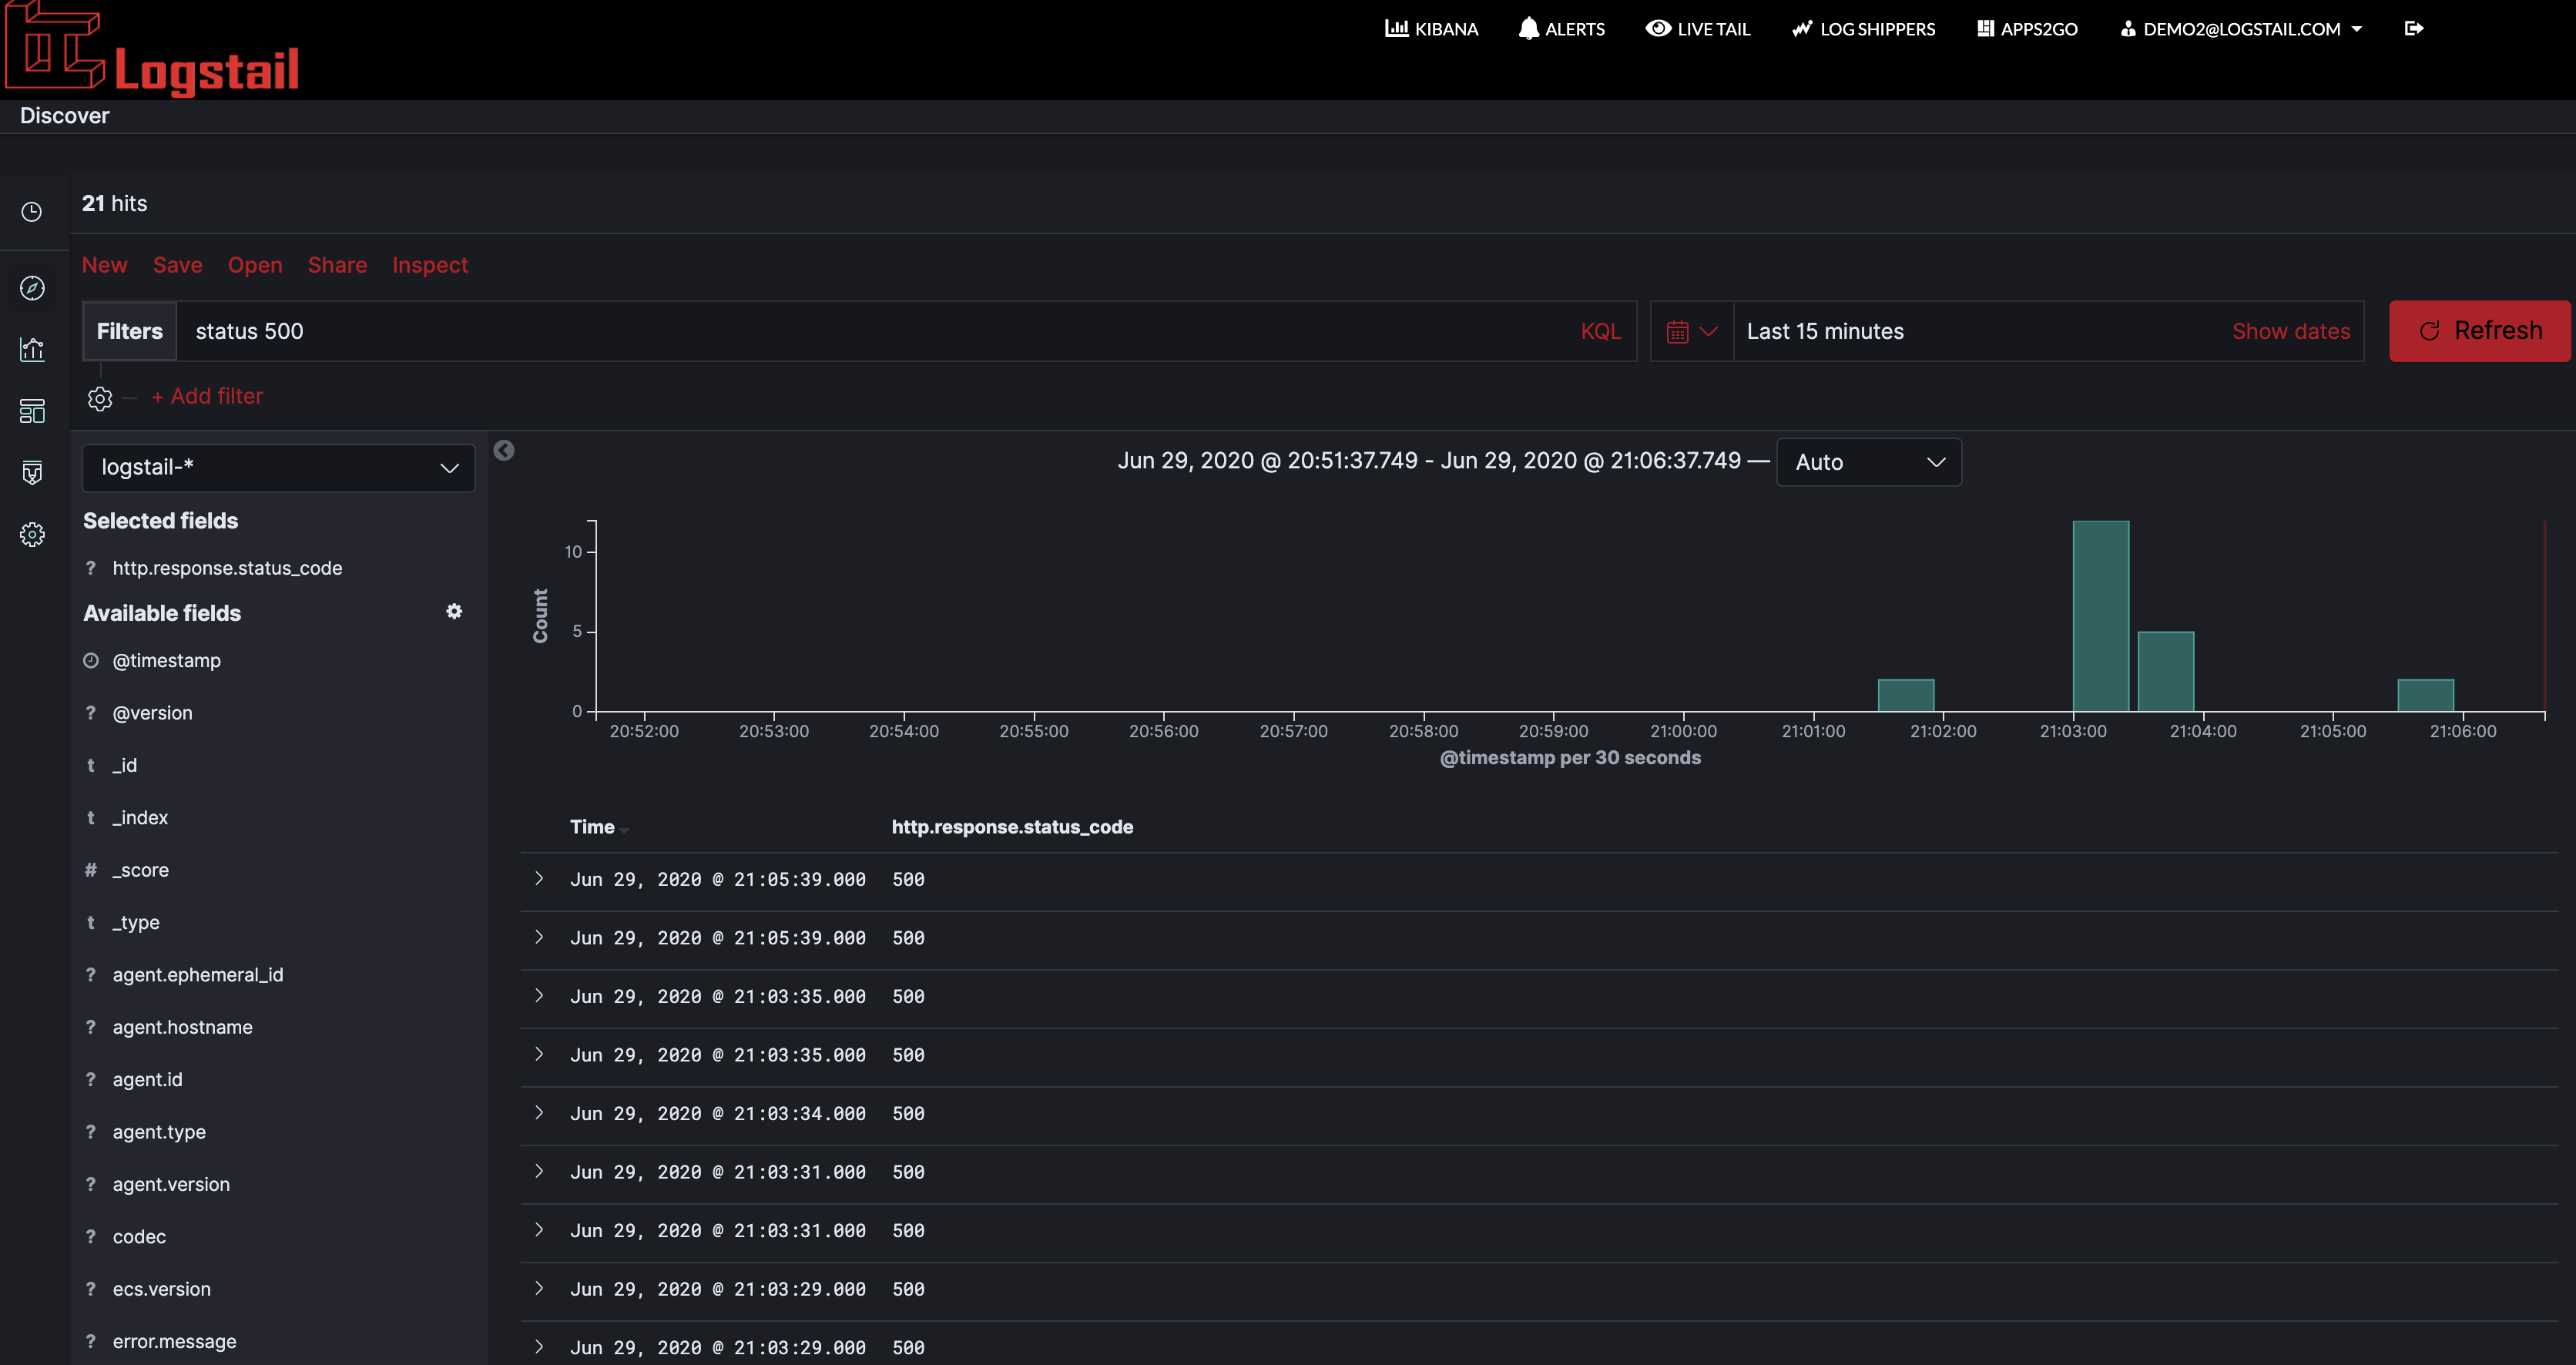
Now you can query your logs with the help of Kibana. Kibana gives you many query options and features like auto-suggest and auto-complete make searching much easier. For example, you can search with free text. Just enter your search query in the search field as follows:
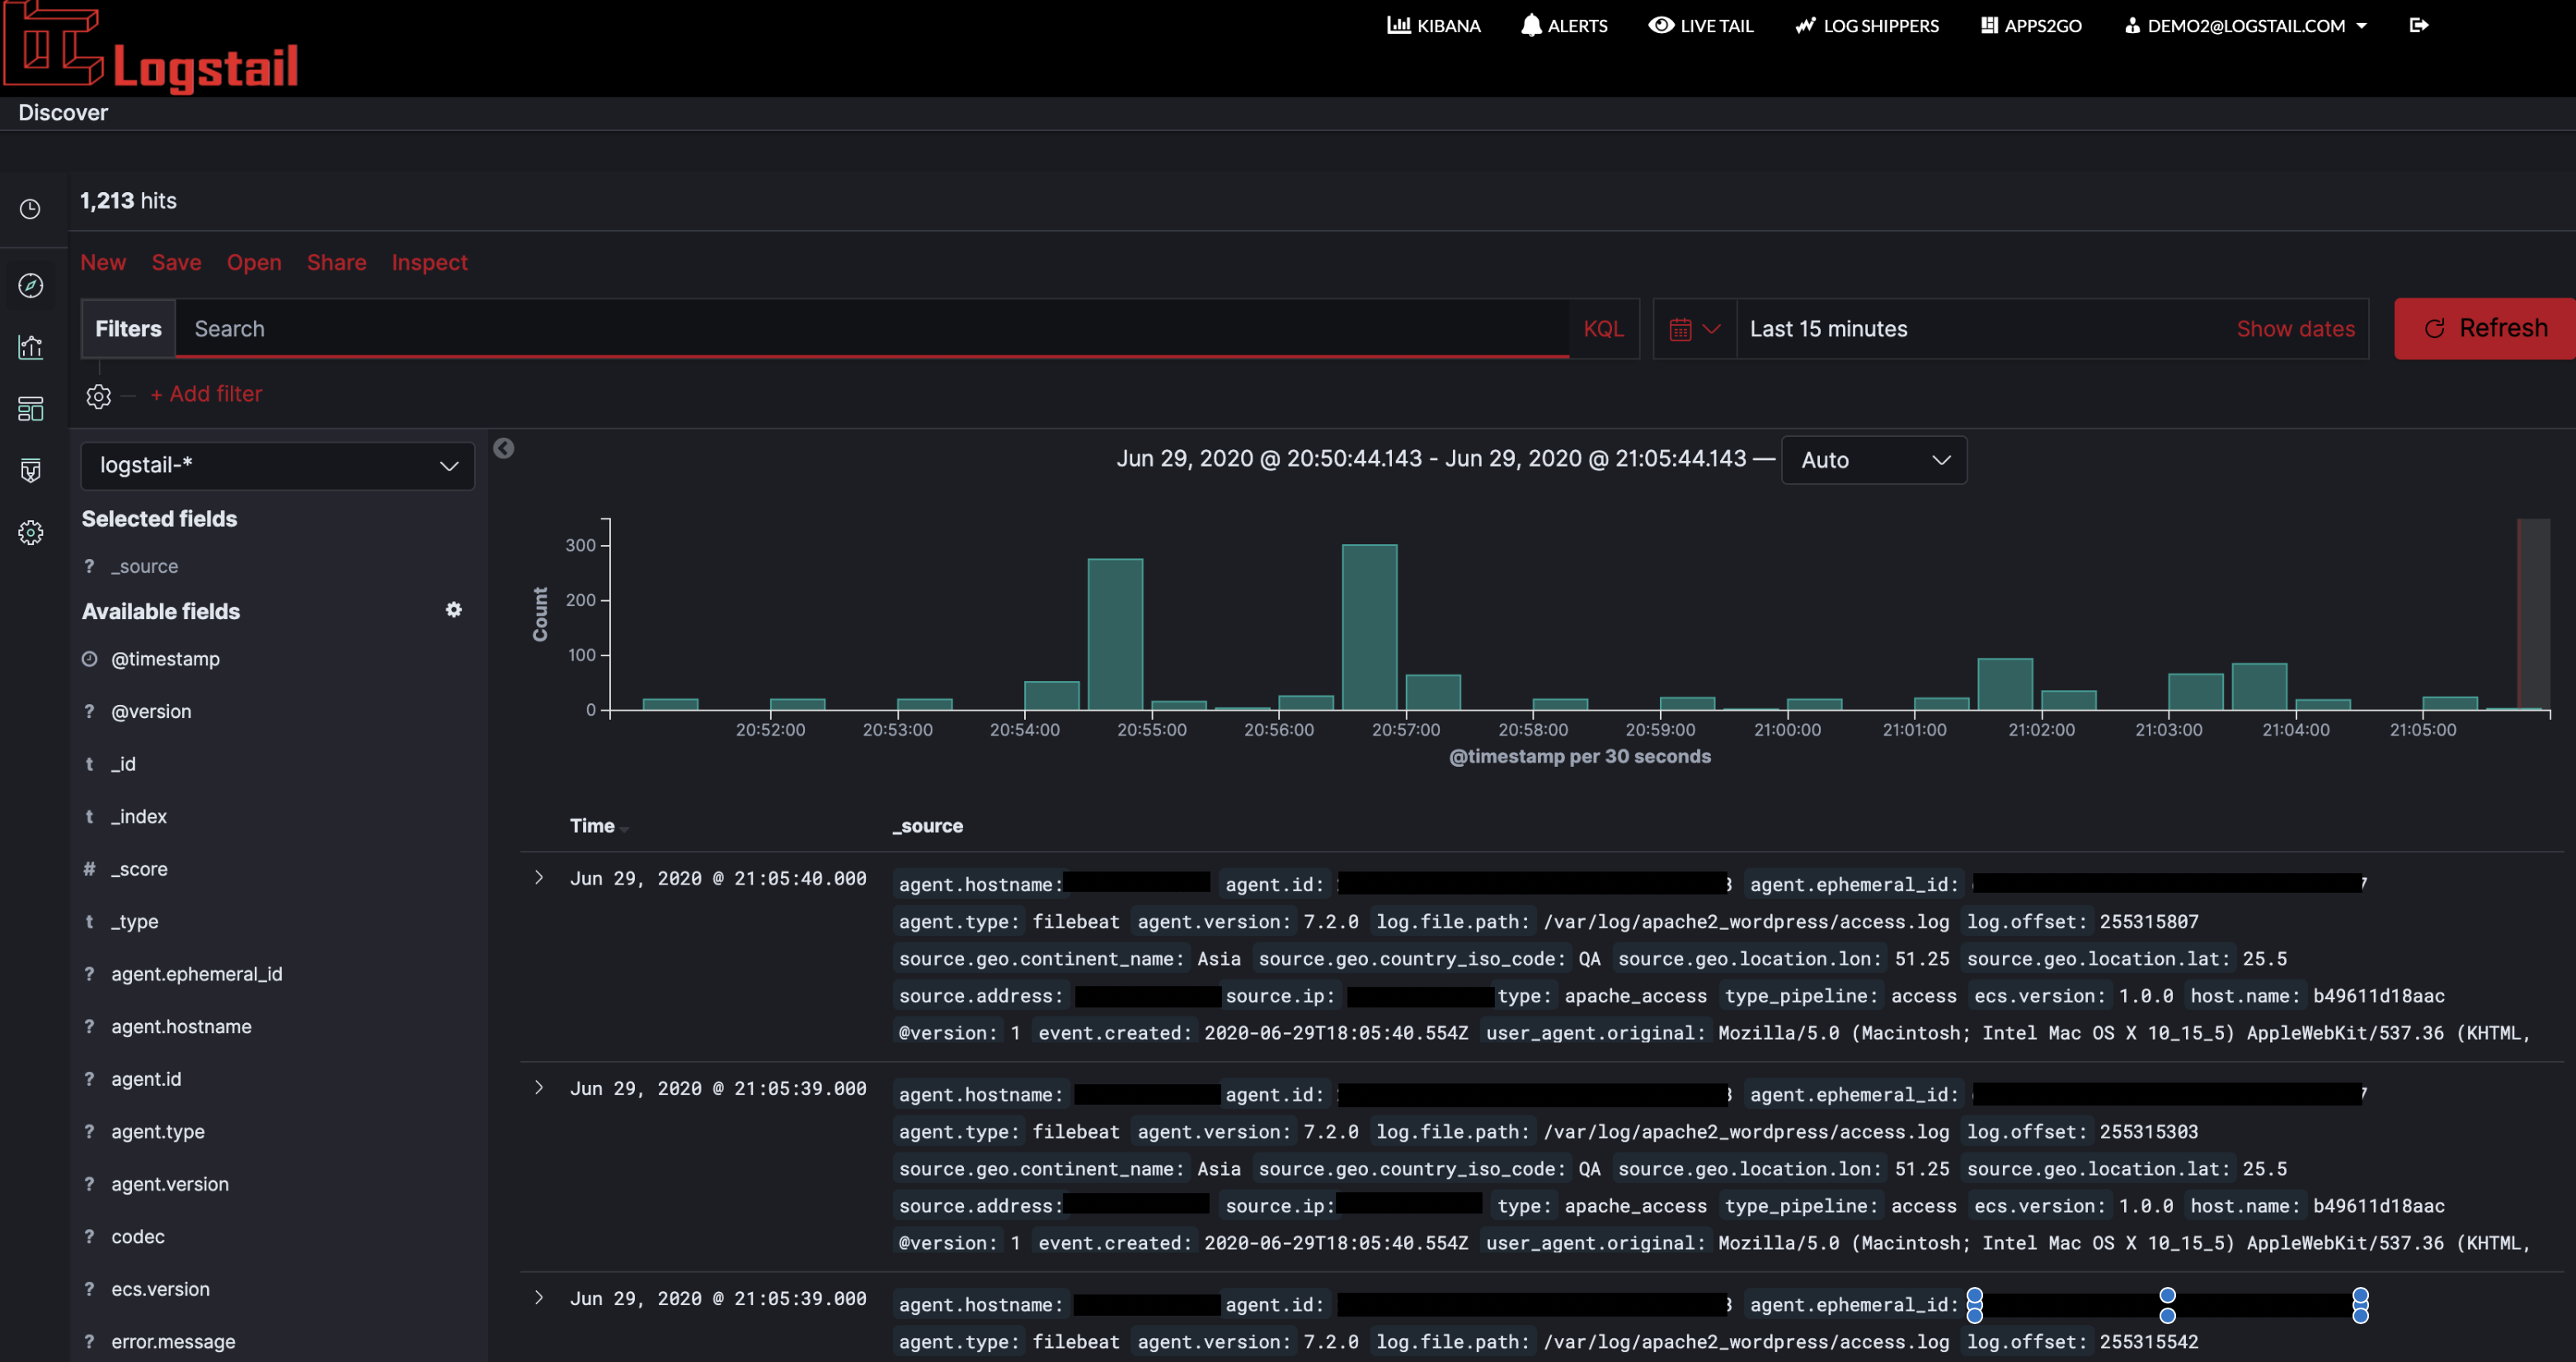
In relation to WordPress we can make specific searches with error type 500 (Internal Server Error) for our HTTP responses : status 500
Concerning MySQL, we can also make specific searches in the logstail-mysql-* index for any MySQL error log for the last days using this search query: type mysql_error
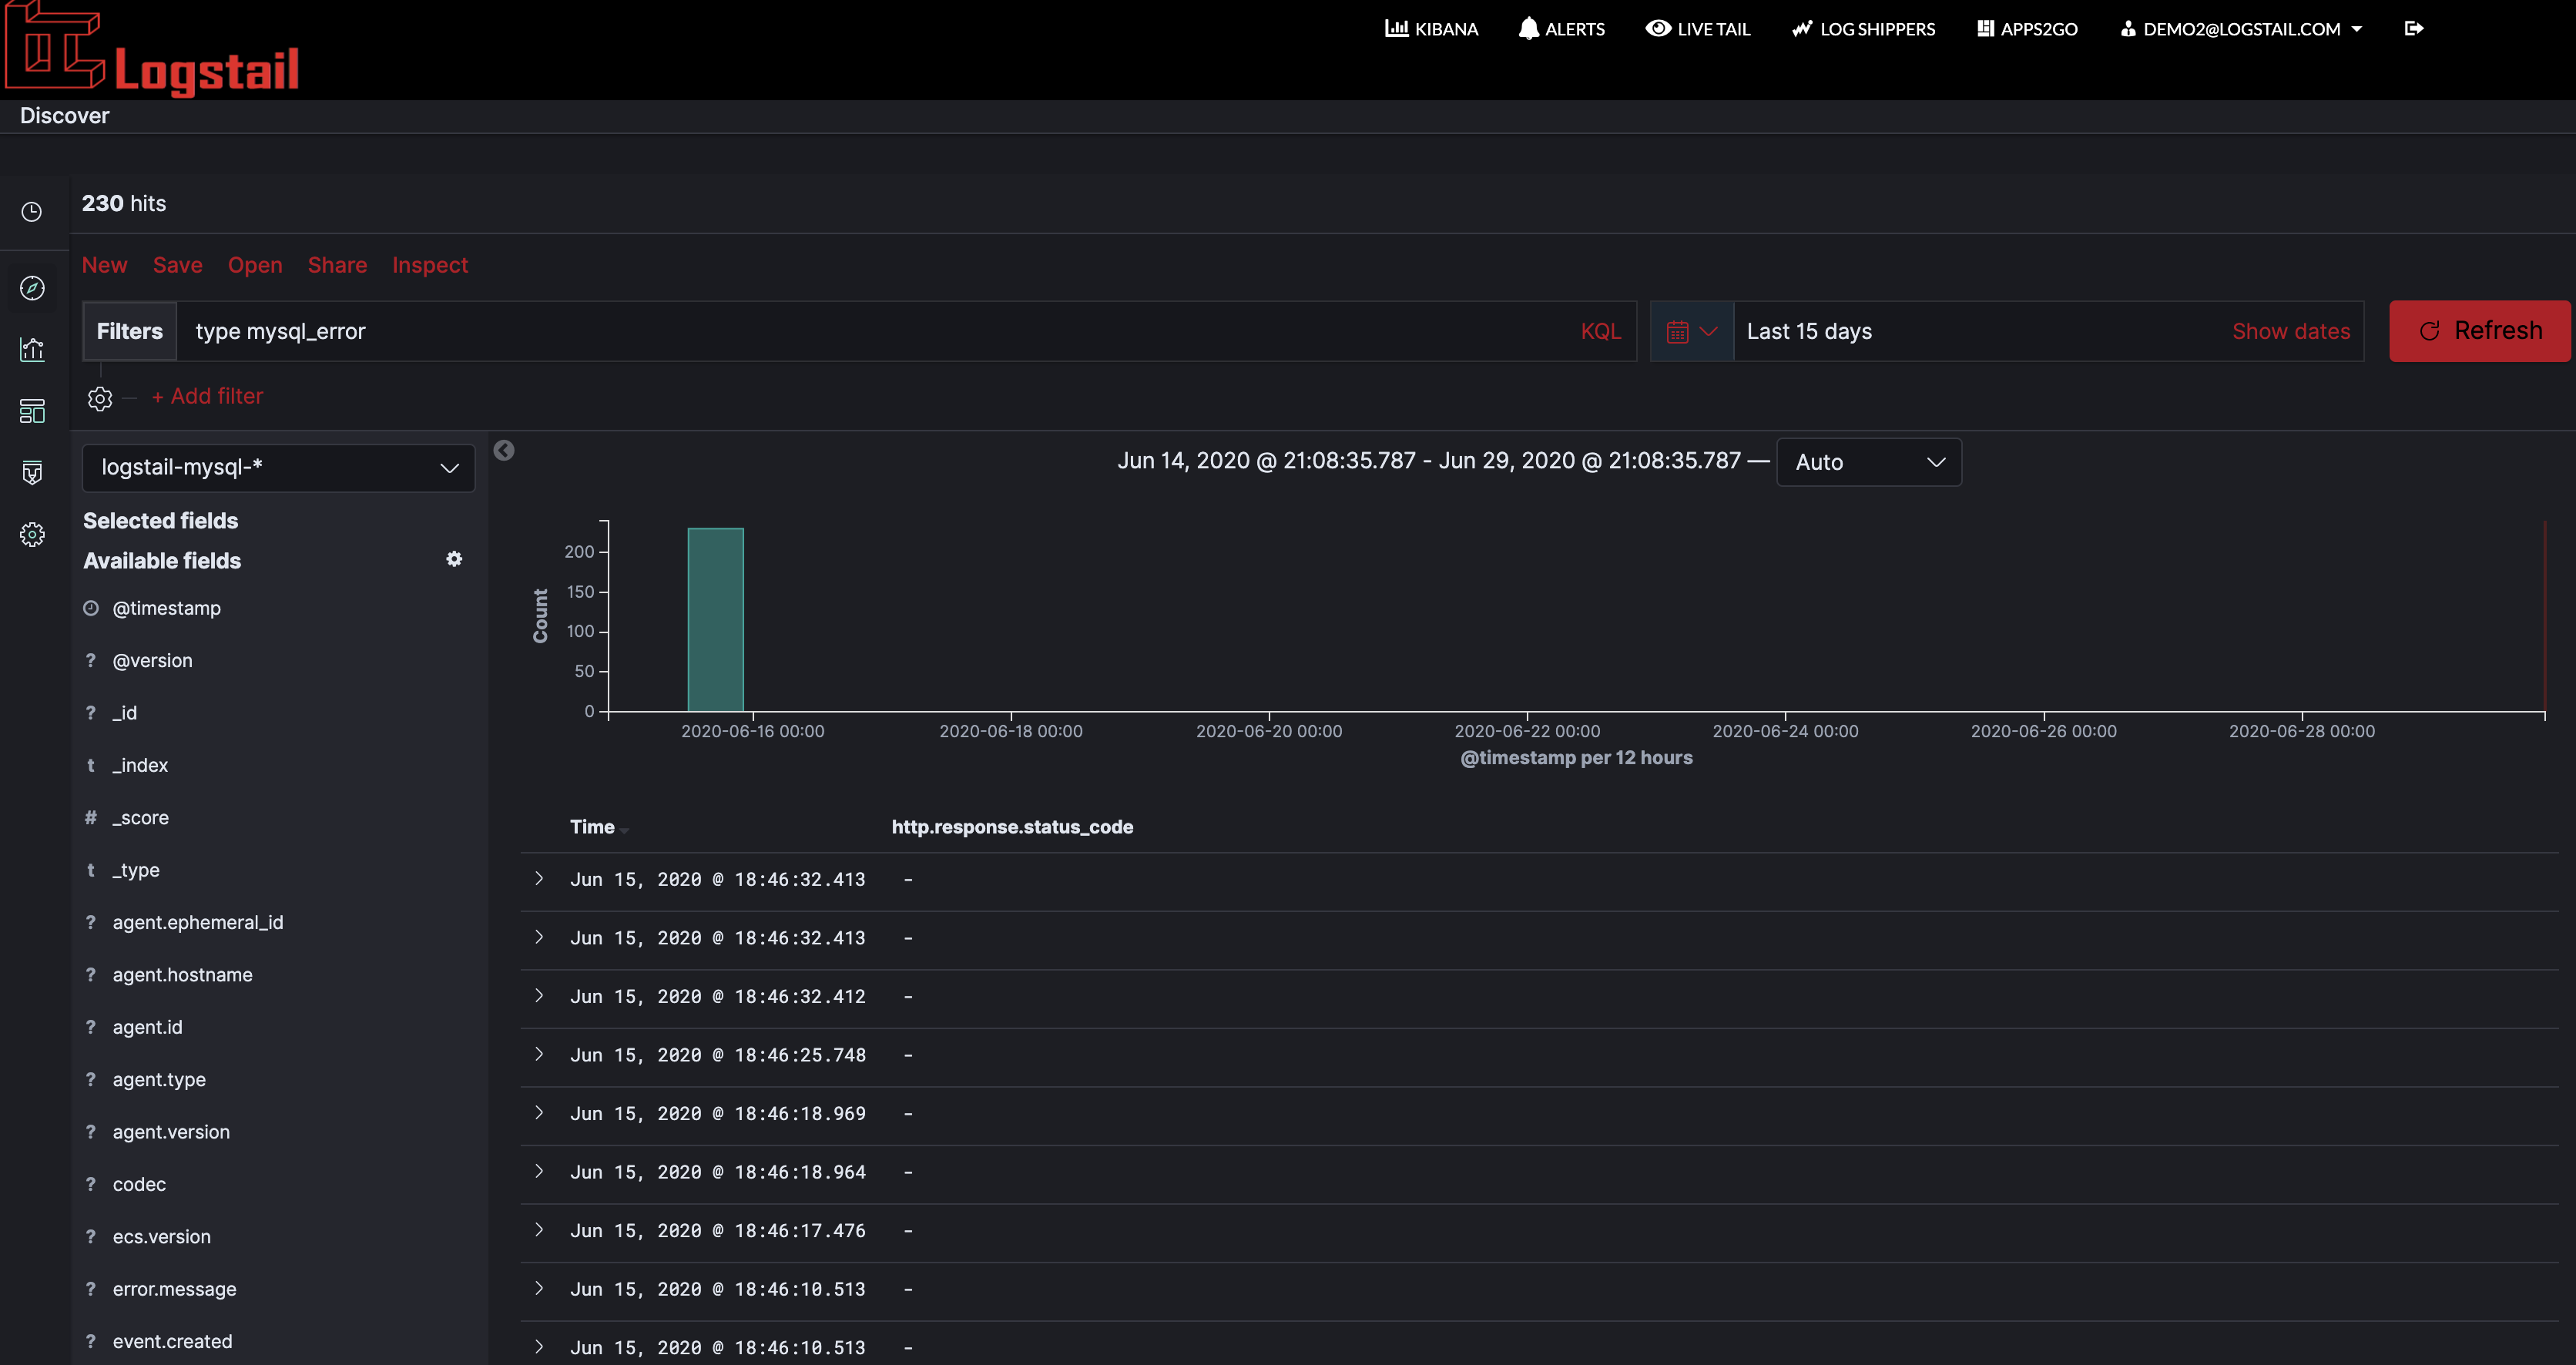
With these types of searches, you can find problems in your WordPress site!!
How to visualize them (or how to work with a dashboard!)
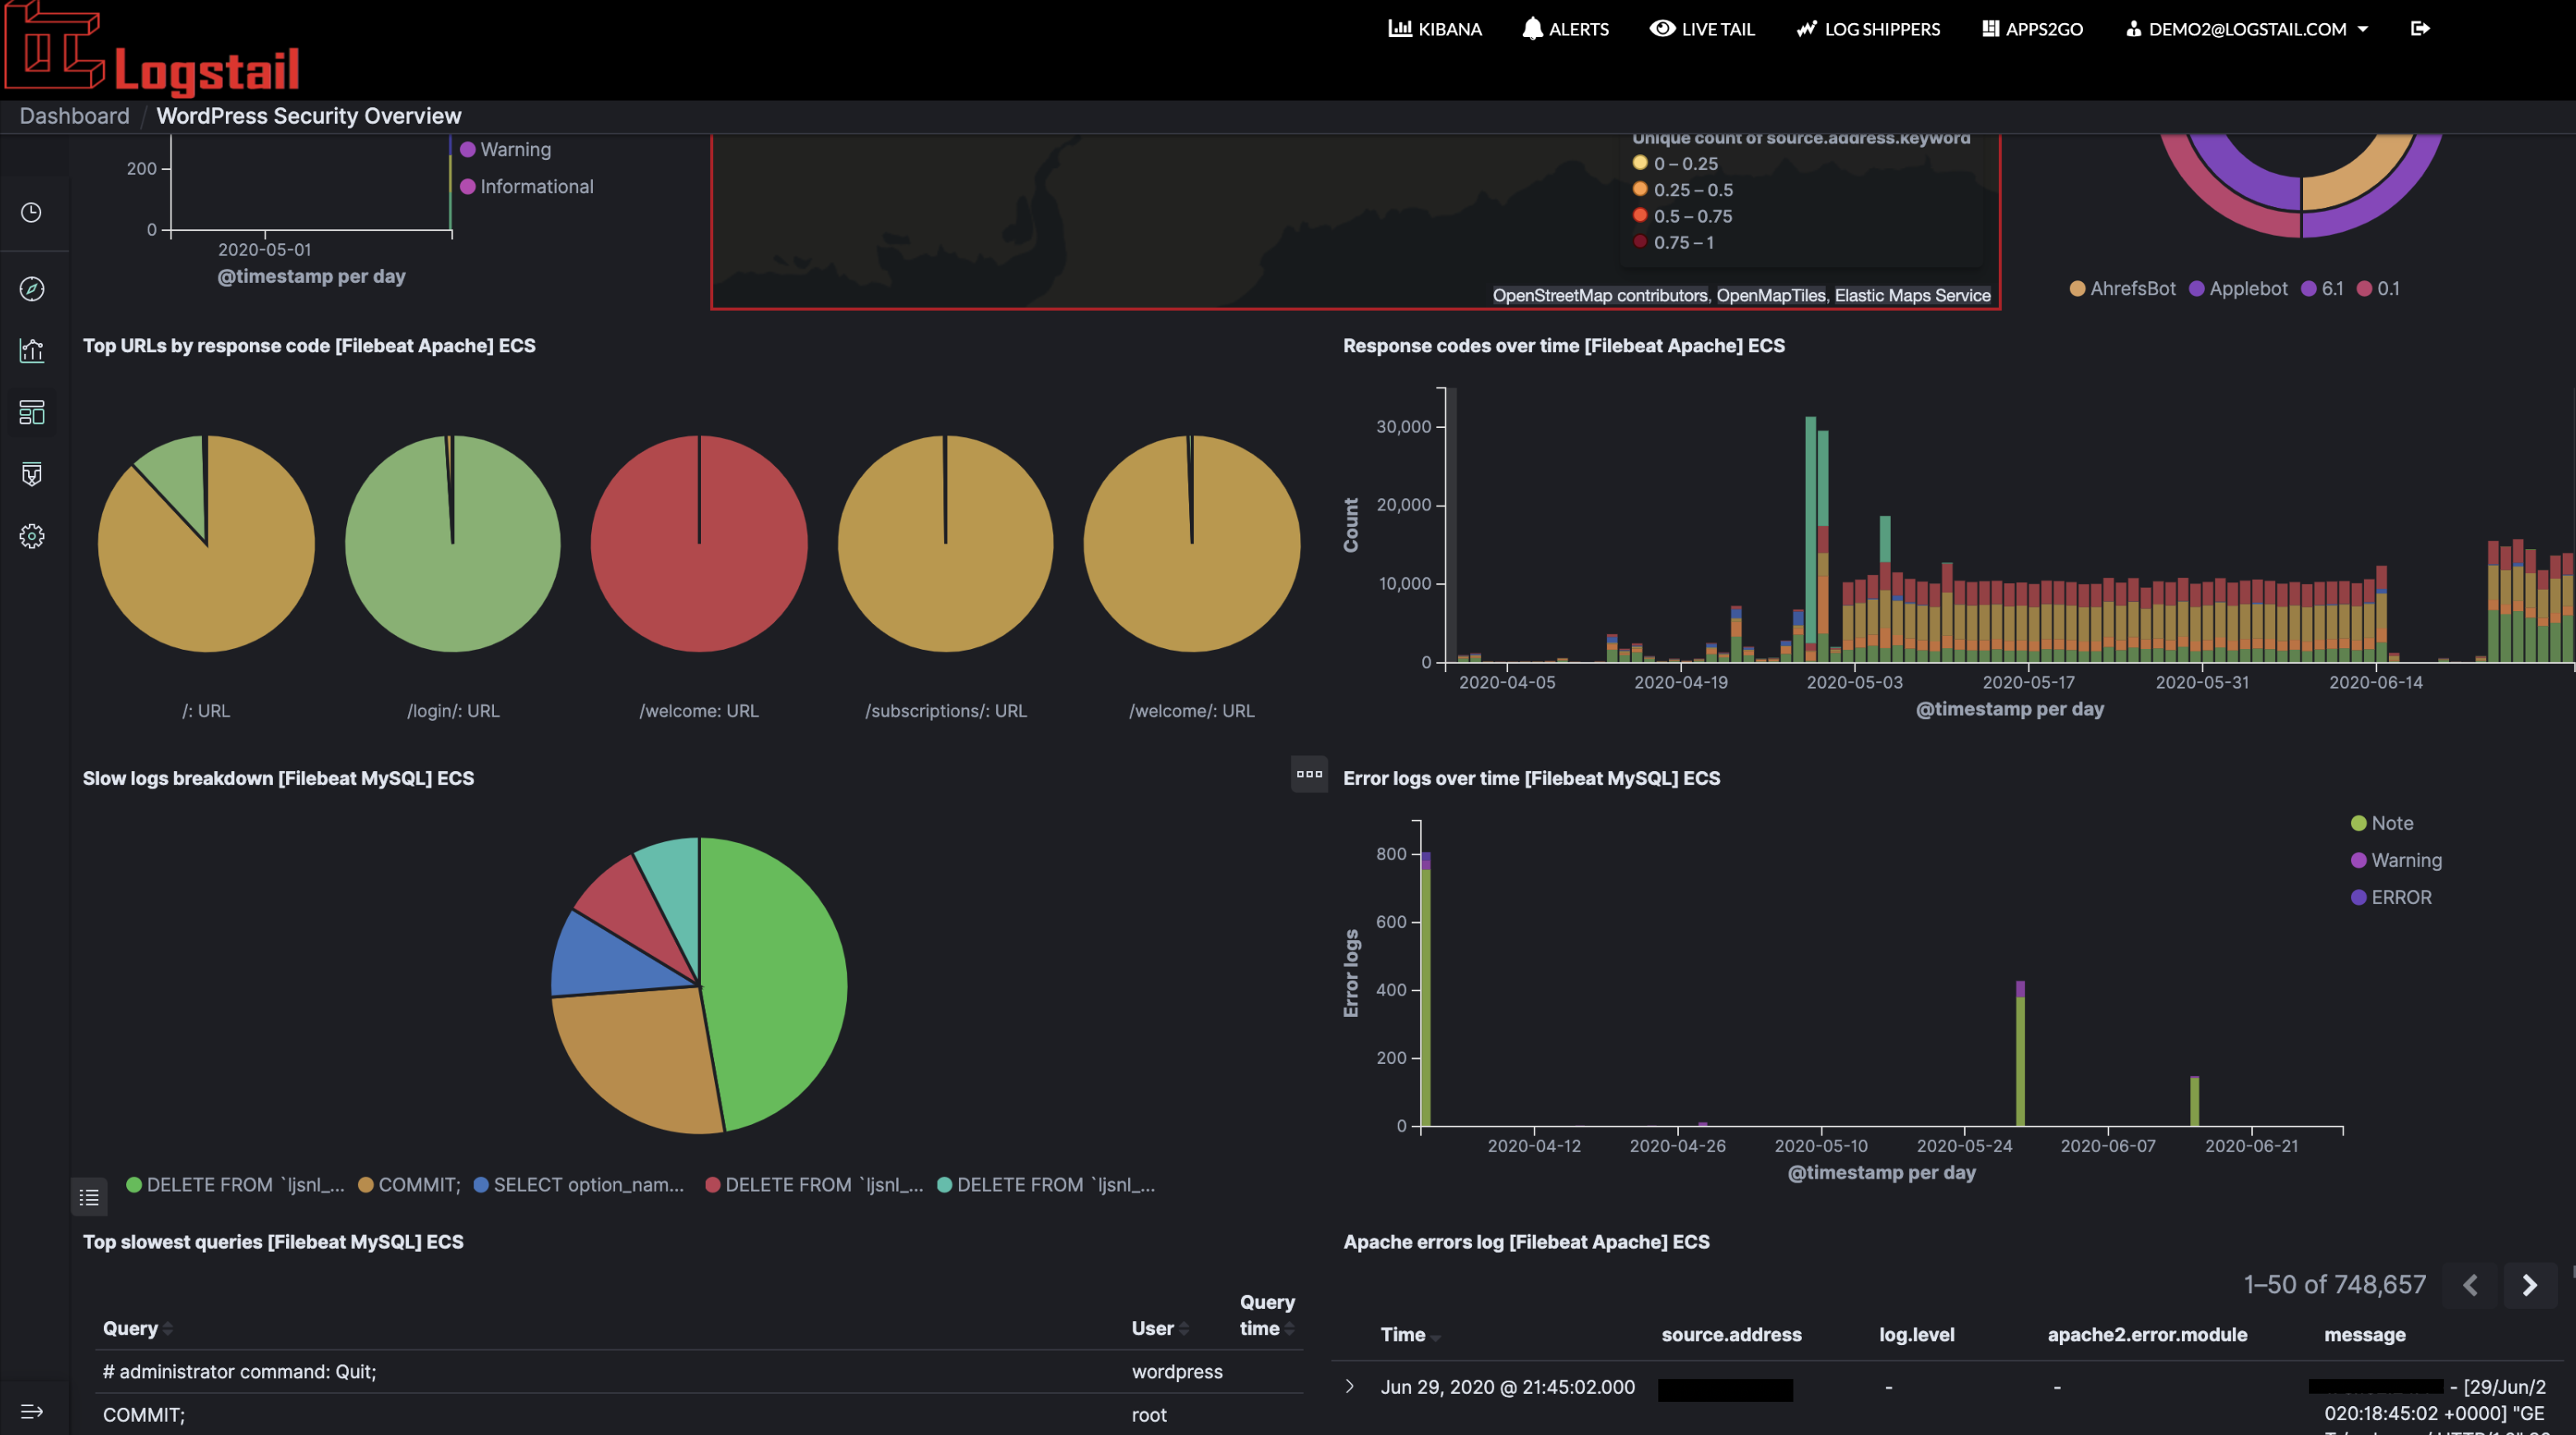
With Kibana you can instantly visualize your data with dashboards in many different ways. In Logstail we created a custom dashboard called WordPress Security Overview where you can quickly find any problem related to your infrastructure. Our dashboard gathers and visualizes a lot of information that otherwise would be difficult to investigate. More importantly, you can correlate this information in order to quickly identify the issue.
In particular, in this dashboard, there is gathered information about:
- The WordPress ID, which lets you identify and distinguish different WordPress sites hosted under the same server.
- Operating Systems breakdown, which gives you an overview of the systems that visited your websites.
- Unique IPs map, a nice map visualization of the location of the IPs that visited your infrastructure, based on Apache server information.
- Slow queries over time, a piece of important information for identifying issues causing delays, based on MySQL Information.
- Error logs over time, a graph visualization about issues the Apache server has identified.
- PHP logs over time, a similar graph visualization to Apache, but for PHP logs, based on your PHP server.
- Browsers breakdown, which gives you an overview of the web browsers that visited your websites.
- Top URLs by Response Code, a pie chart about the most frequently visited URLs of your sites.
- Response codes over time, based on Apache server information.
- Slow logs breakdown, where you get an idea of the types of the slow logs of your database, based on MySQL Server information.
- Error logs over time, where you get a chronological representation of the database error logs, based on MySQL Server information.
- Top slowest queries, based on MySQL Server Information.
- Apache error logs, produced by the web server.
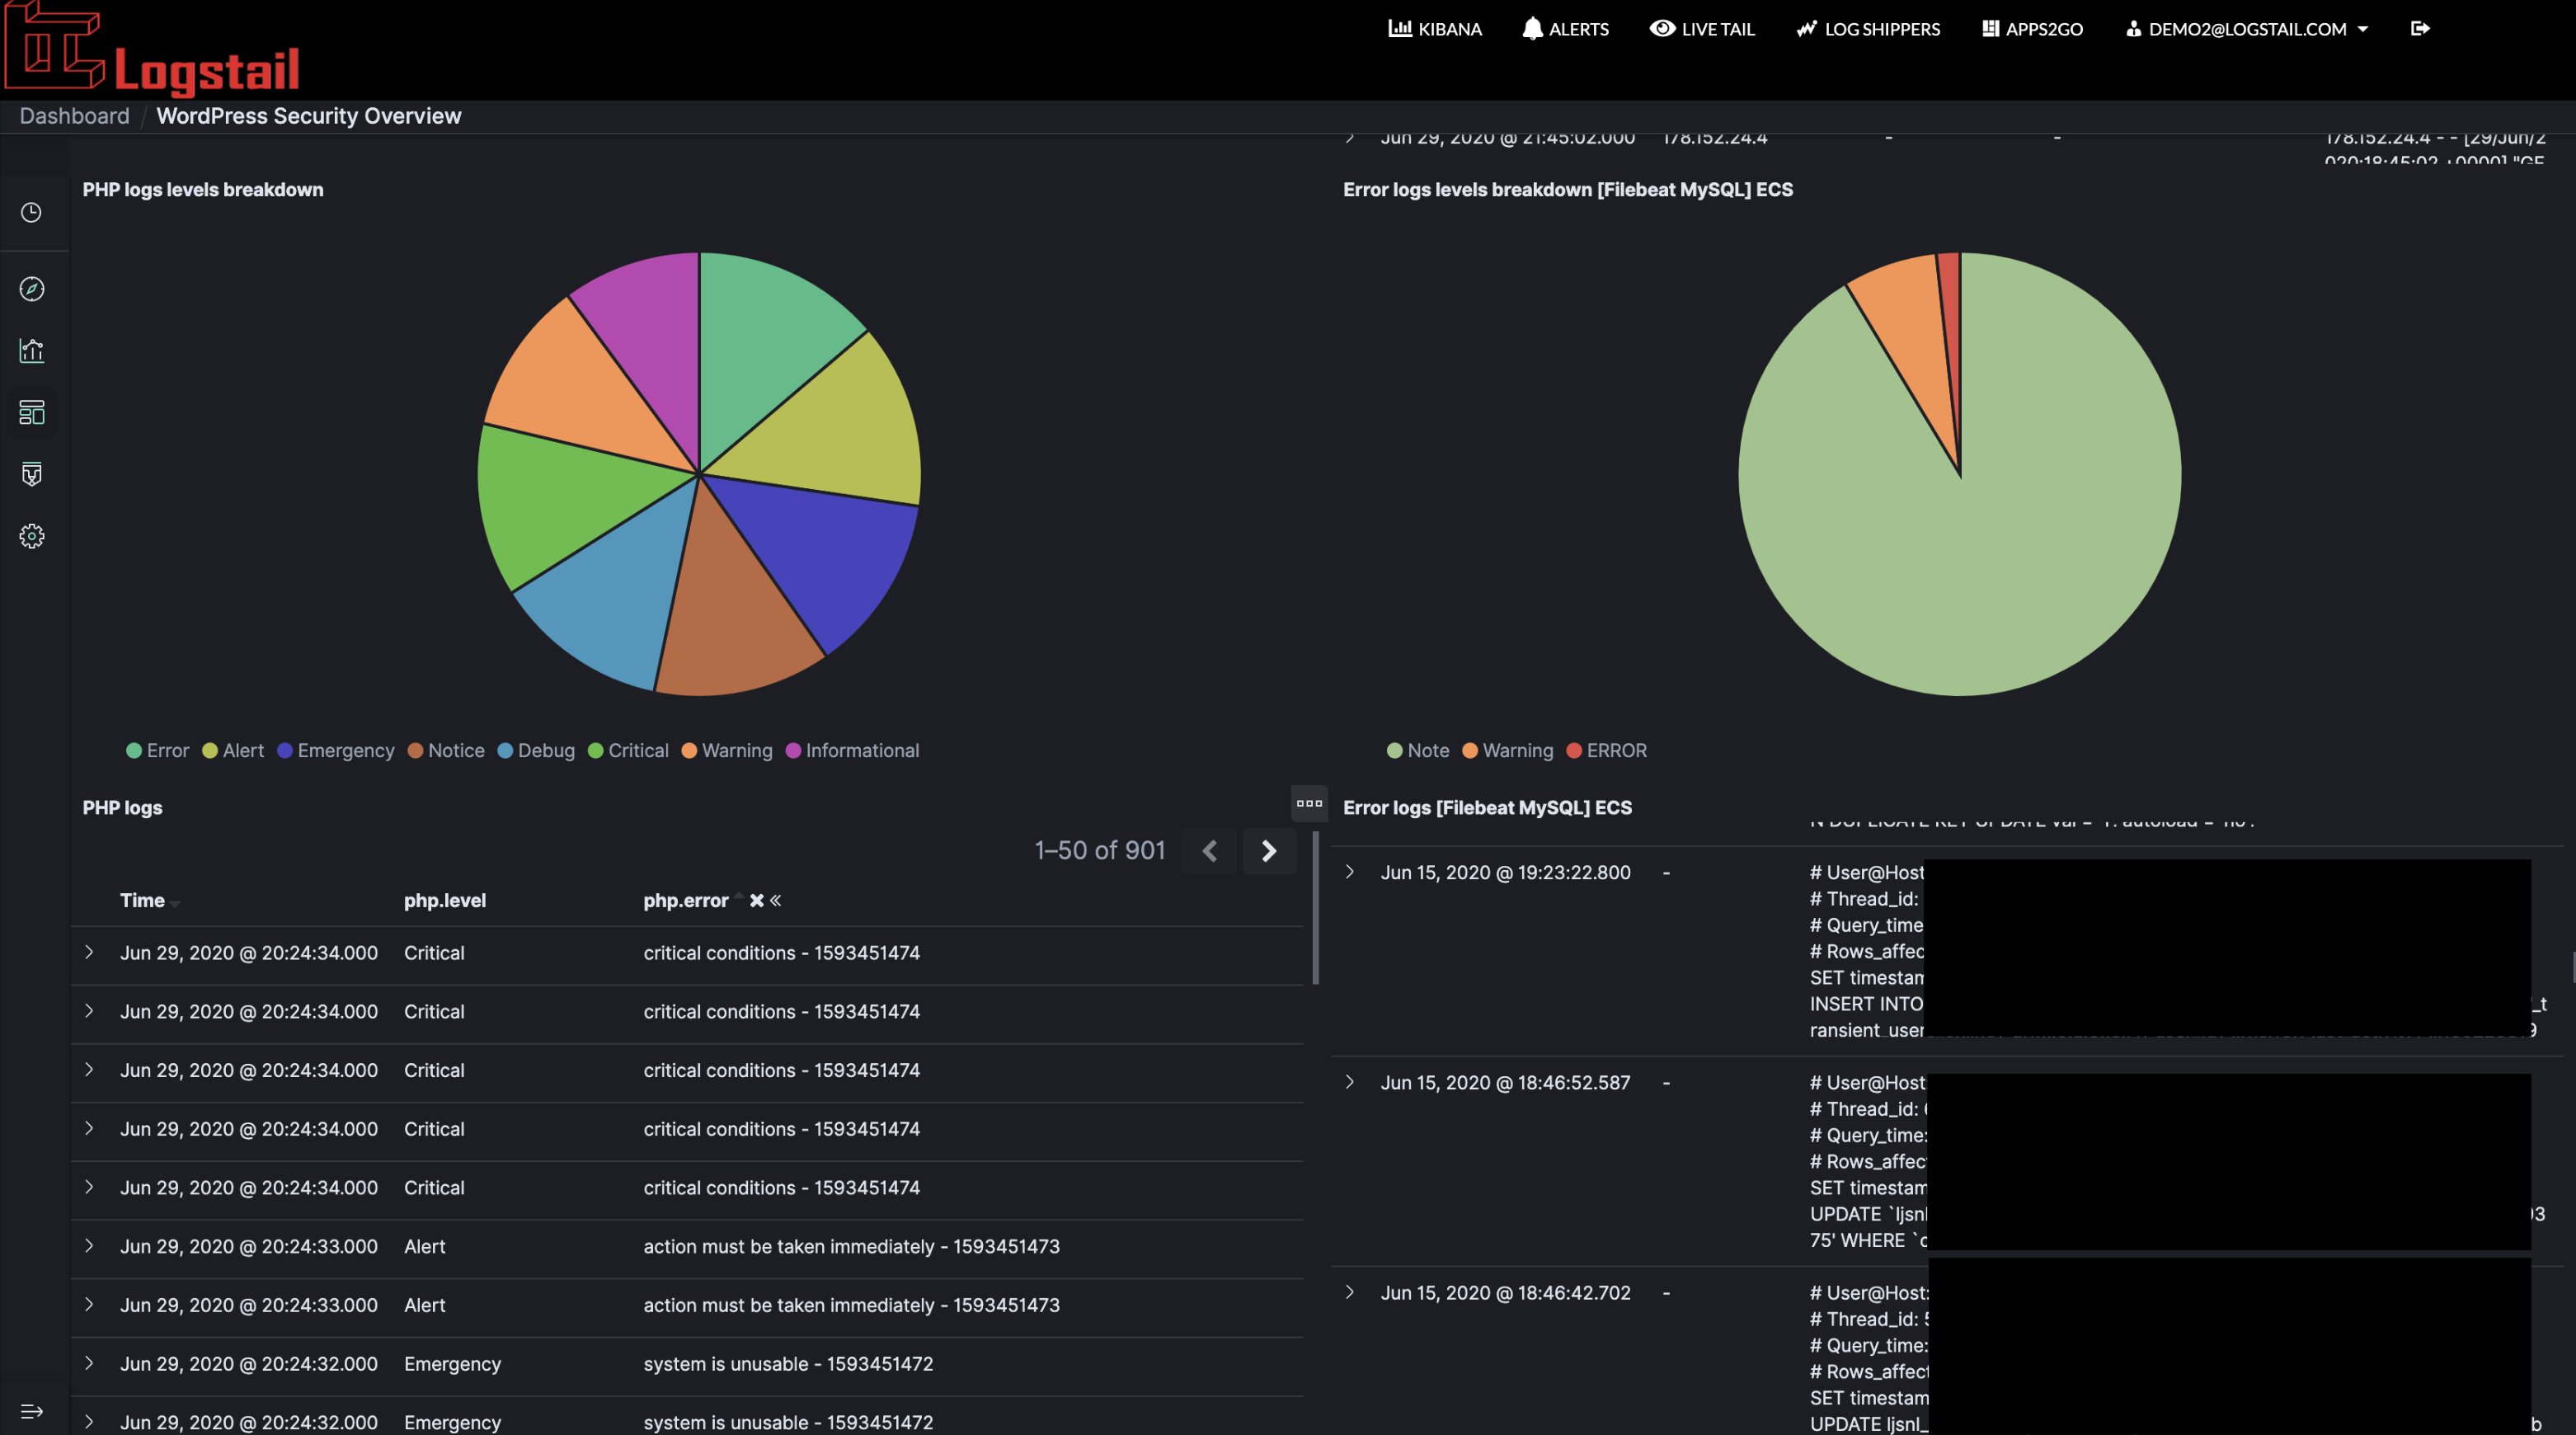
- PHP levels logs breakdown, a pie chart about the severity level of the logs produced by the PHP Server.
- Error logs levels breakdown, a pie chart about the severity level of the error logs produced by the MySQL Server.
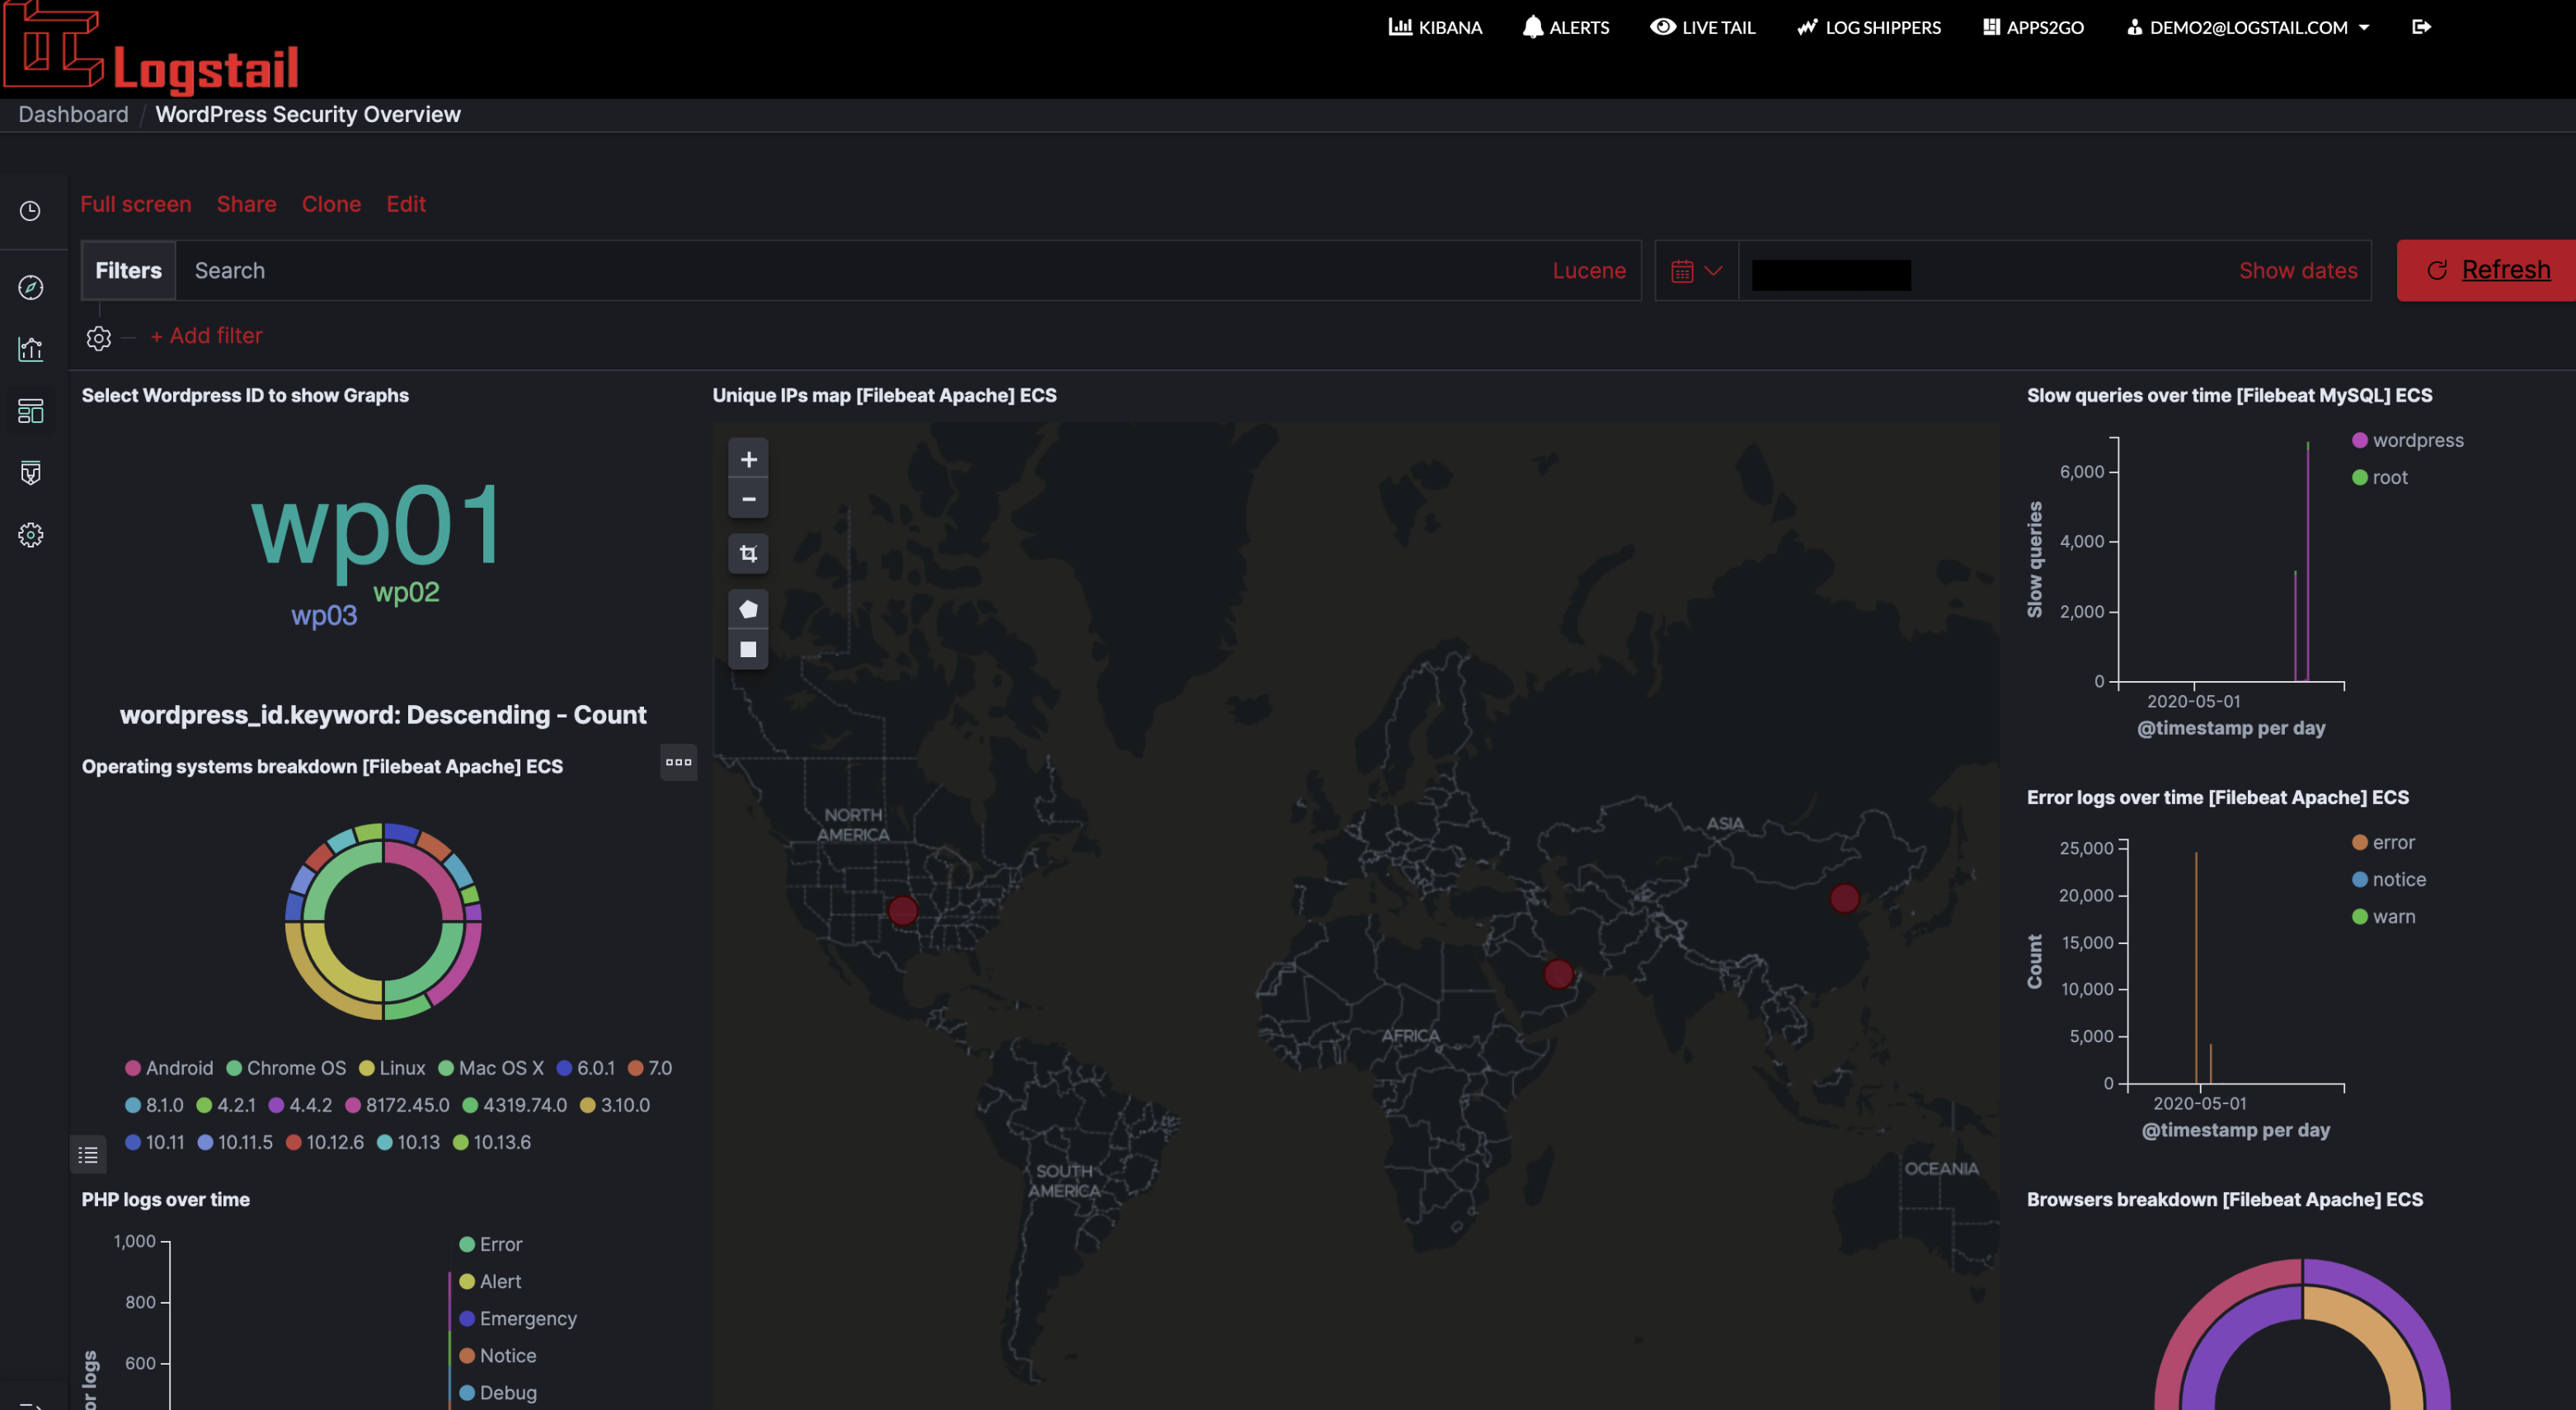
With this amount of information, you can quickly identify the problem and resolve it. Additionally, don’t forget that you can edit this dashboard by resizing, moving, deleting, or changing the visualization type (eg. from a line to a bar)! And after finishing you can save the modified dashboard for later use!
Alerting
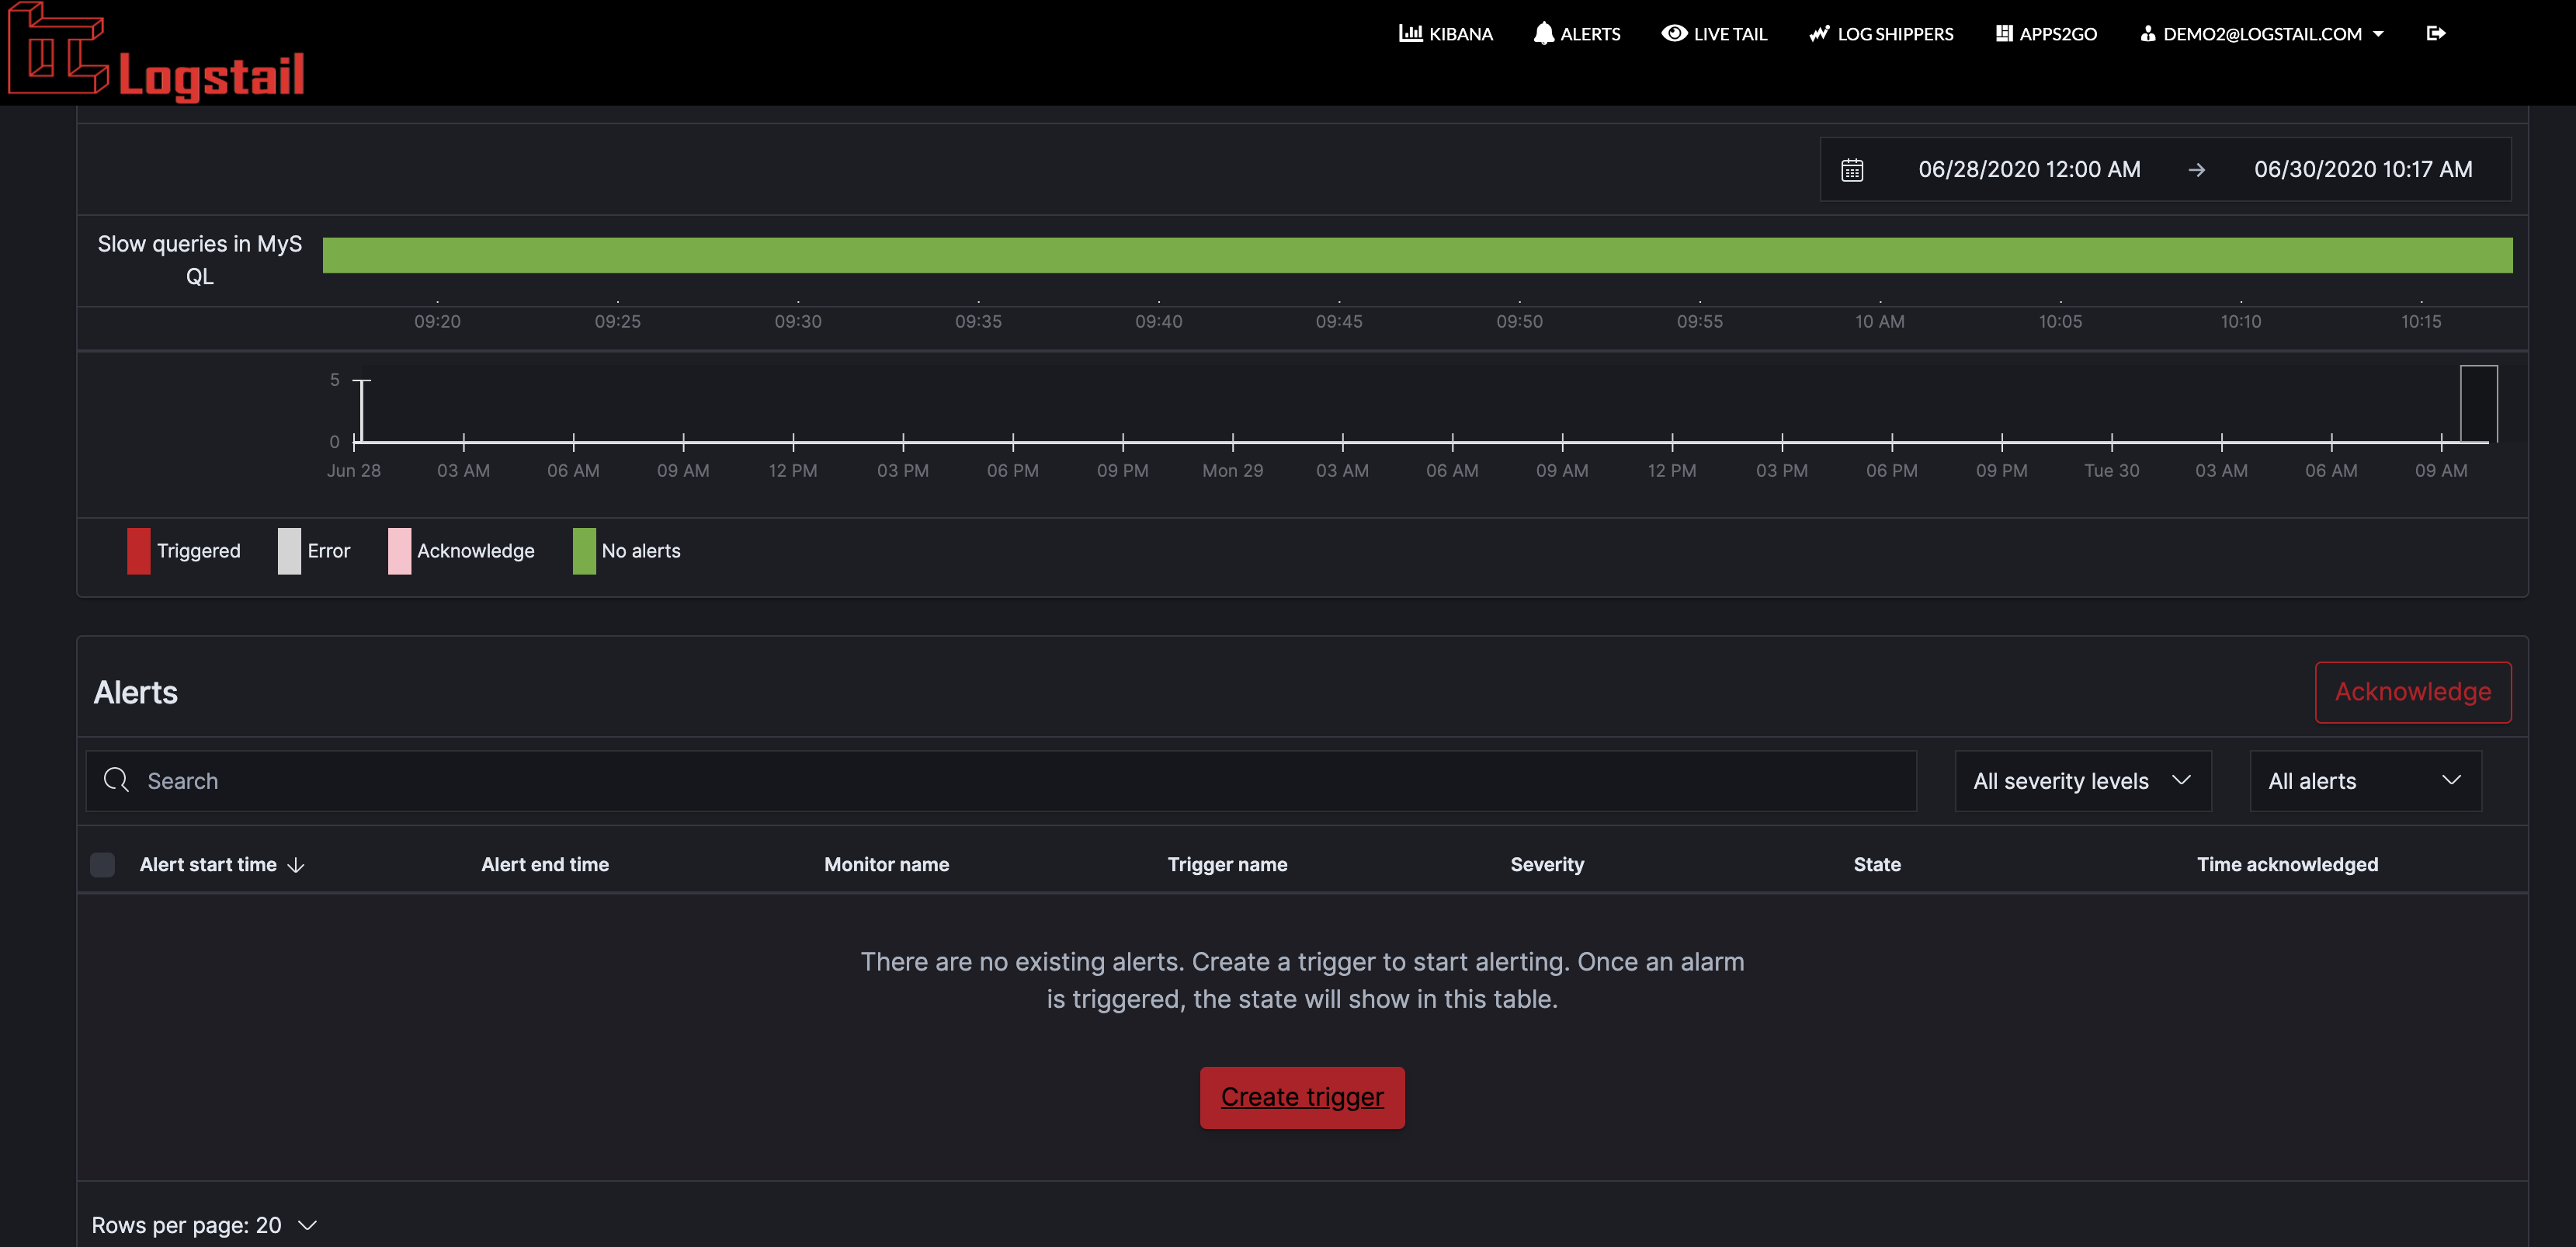
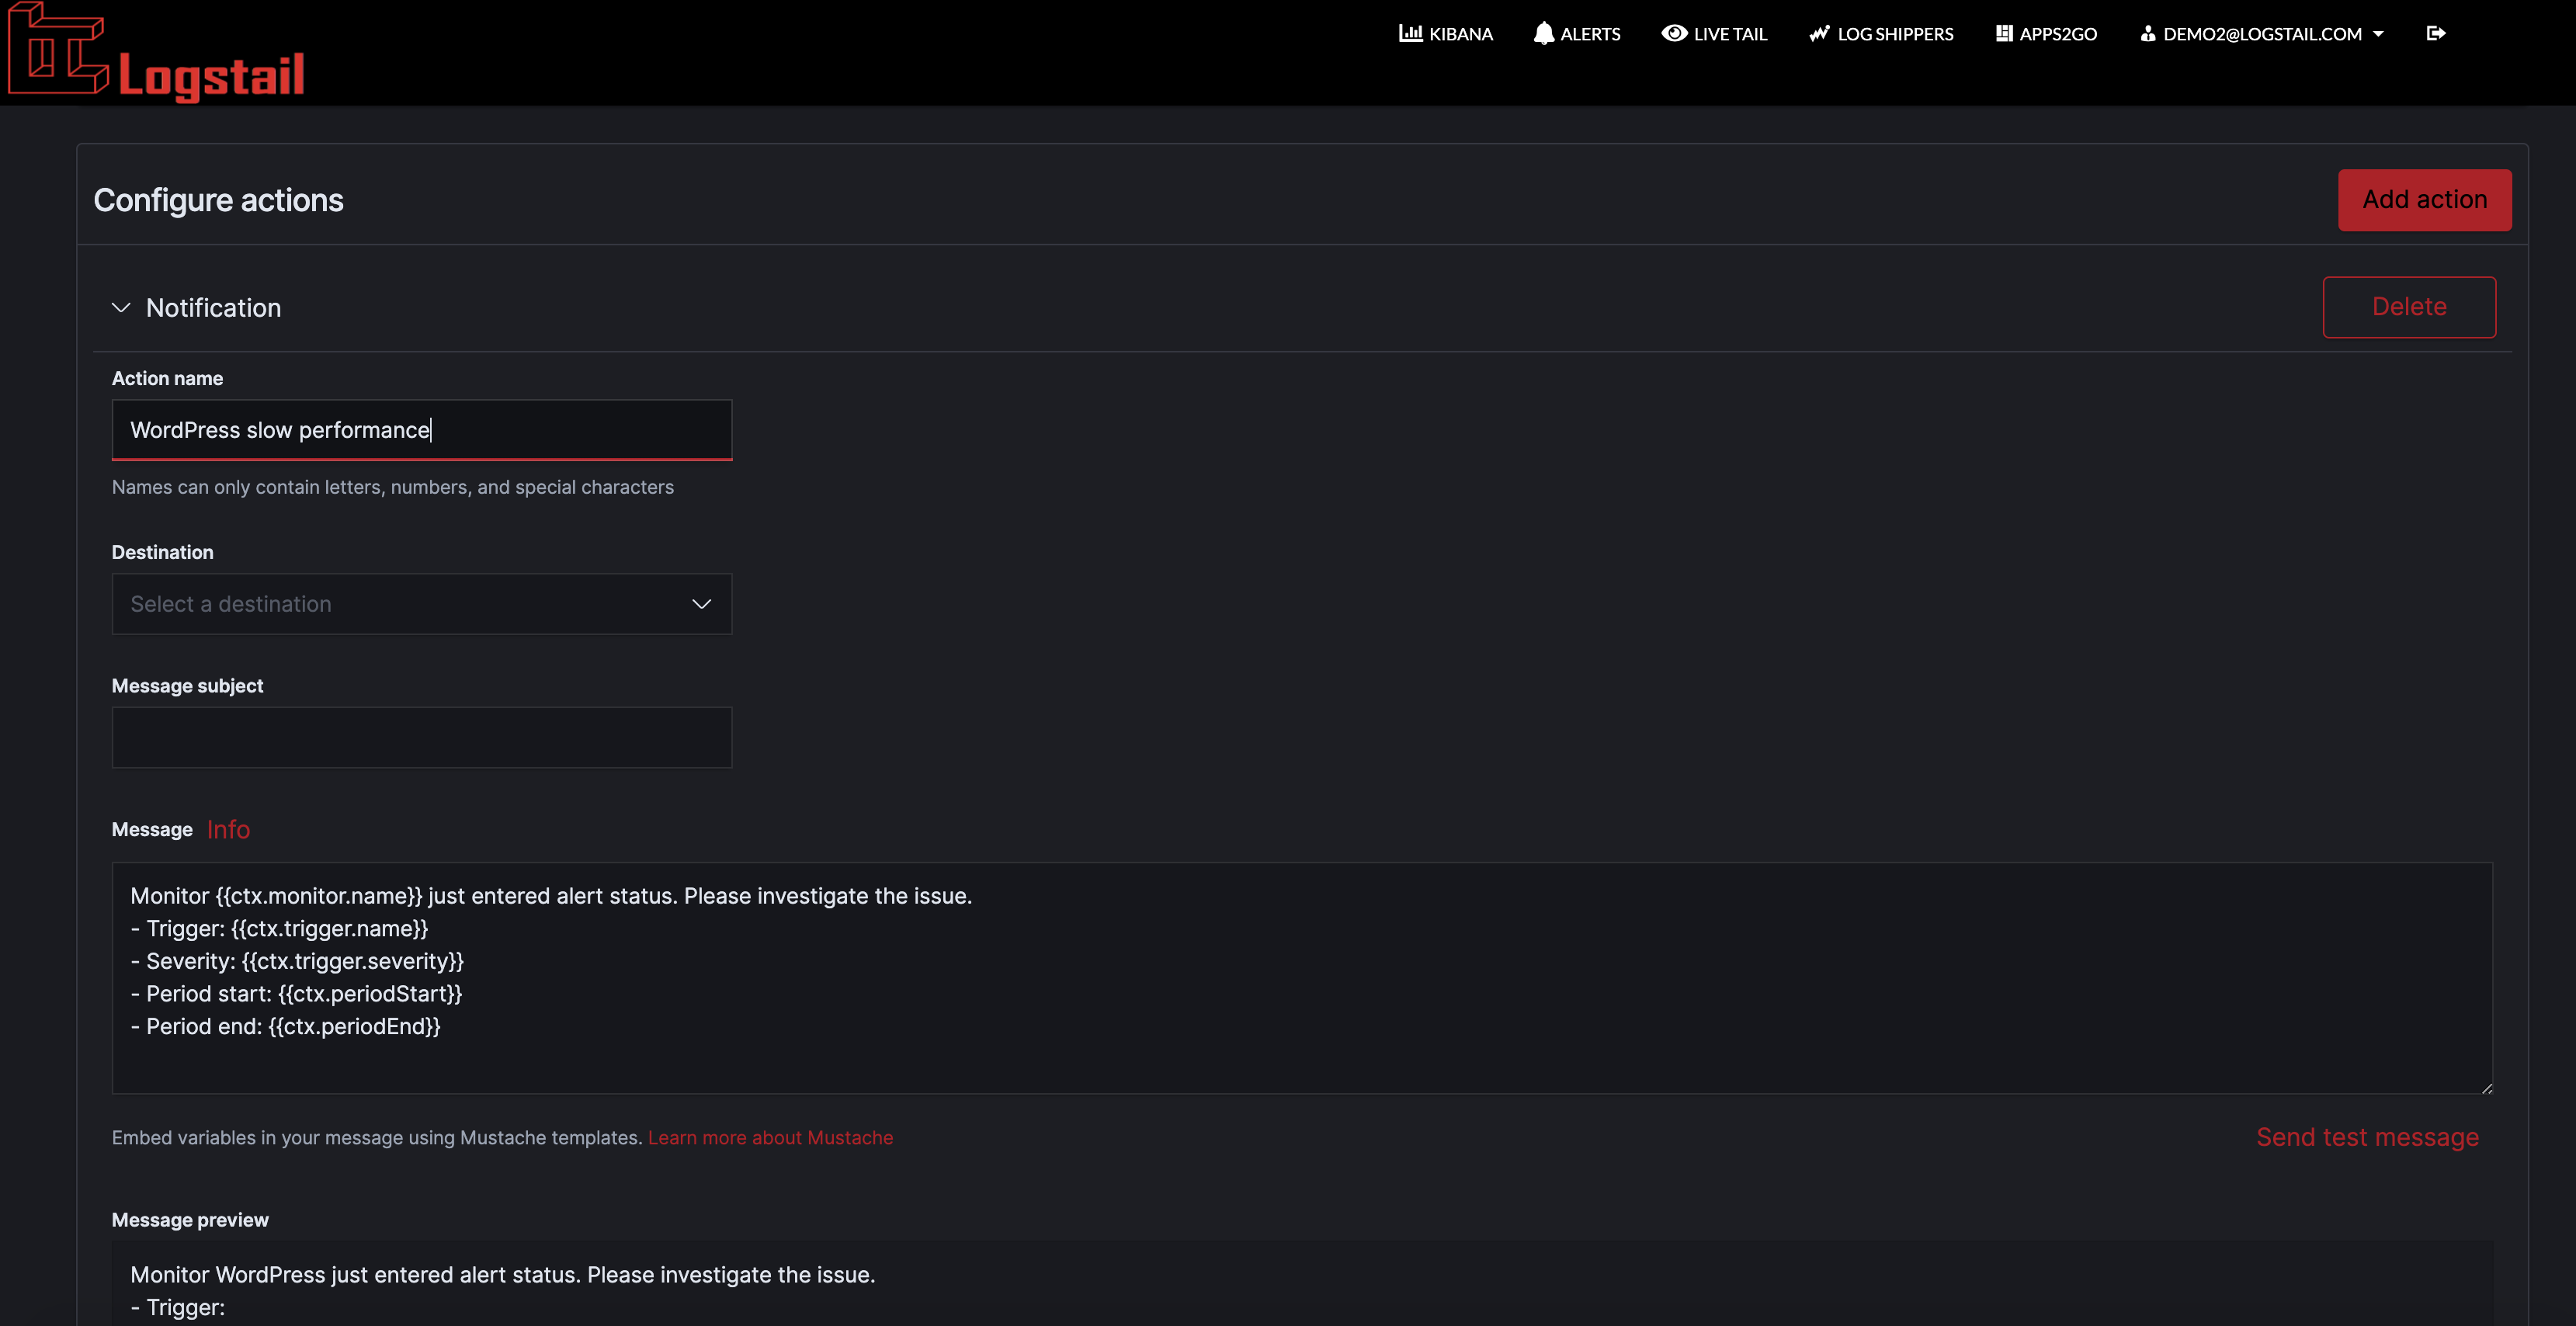
Alerting is an extremely useful feature provided by Logstail.com. We provide you a mechanism to receive alerts through Slack when certain indicators exceed the thresholds been defined. Now you have the ability to immediately realize performance-related or other issues and take the appropriate measures to mitigate the problem. In our case, for example, you can be notified when MySQL starts to produce slow logs. You can find a very detailed article about how our alerting mechanism works, here!
Use cases
In this section, we will describe some basic use cases on different issues that may occur when using WordPress. These are the following:
- WordPress is slow and performance is reduced
- There is a drop in website traffic
- Many failed login attempts, forgot password requests, suspicious new accounts, new links on the website that do not belong to our website
1) WordPress is slow and performance is reduced
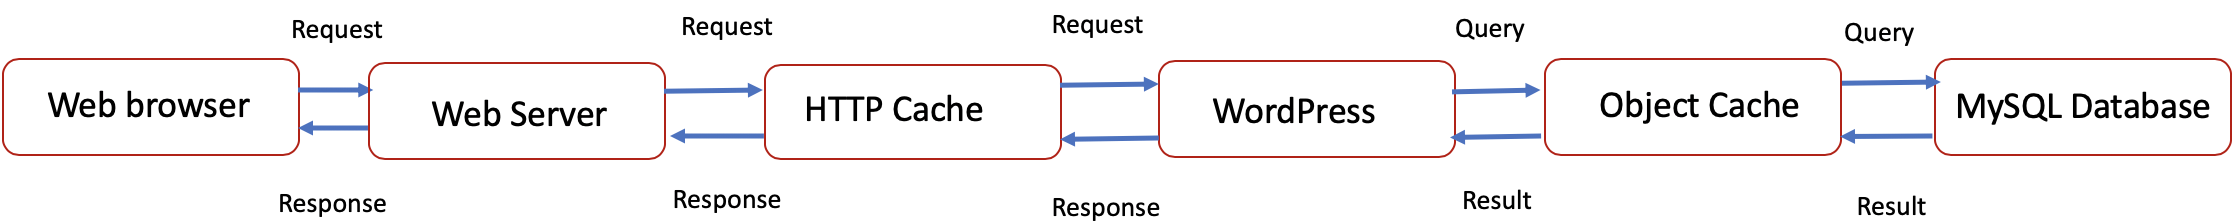
When you observe that your WordPress website is not performing as expected, then initially you have to look for slow logs. In the next diagram, you can see how WordPress makes queries to the MySQL Database. If the database is not performing well, then it will produce slow logs. As previously mentioned, we have a thorough article about MySQL logs in our blog.
By using our preconfigured dashboard described above, you can rapidly observe when the issue started to occur and take the appropriate steps immediately.
2) There is a drop in website traffic
When you realize a drop in website traffic, you can refer as a first step to the Apache logs and when you define the time frame that the drop in traffic started, then you can go to a different log source type (eg. MySQL logs) and start looking for logs that have been produced at the same time. Following this method, you can quickly identify any potential issues and resolve them.
3) Many failed login attempts, forgot password requests, suspicious new accounts, new links on the website that do not belong to our website
A large amount of failed login attempts is something that has to be investigated immediately, because it may lead to a compromise. You can quickly start your investigation by sorting the top URLs requested in the Top URLs by response code [Filebeat Apache] ECS Visualisation and find one or many IP addresses that are attempting to access your resources. The next step is to correlate this information with Error logs over time of Apache in order to get an indication of the number of errors reported by the web server for the time frame we are investigating. Also, if you or your customers are complaining about unknown links, you can quickly search for these links in your logs and find where do they appear. From there, you can navigate to other log sources that produced logs at that specific time frame, in order to acquire a holistic view of the incident.
Conclusion
Logstail.com with its advanced features brings the functionality of ELK Stack to your hands. You don’t have to be an engineer in order to set up and use Elasticsearch anymore. Now you can convert your data into actionable insights with just some tweaks. You can maximize the performance of your infrastructure or be notified of potential problems and take the appropriate actions. Sign-up for a free demo in order to realize yourself the power of Logstail.com .
In relation to WordPress, if we centralize the logging of all the components of our service we will obtain better visibility because the application itself does not offer the ability to correlate logs with additional data sources such as the web server or the database.
Centralized logging with ELK Stack and Logstail.com allows you to do just that — together with the ability to analyze the data and create monitoring dashboards to help you visualize it.