
Dashboards
The Dashboards page provides visual analytics for Logstail data. Dashboards help users monitor security posture, operational trends, endpoint activity, compliance events, and other collected telemetry through charts, tables, counters, and visual panels.
Where to find it
Open the dashboards page from the main navigation.
Navigation path
Application route
/dashboardsWhat This Page Is Used For
Use Dashboards to:
Review visual summaries
See high-level security and operational data.
Monitor SIEM activity
Track important events and trends.
Track trends
Analyze changes over time.
Inspect visual panels
Explore charts and visualizations.
Pivot into investigation
Move from dashboards into deeper analysis.
Create custom views
Build dashboards for specific workflows.
Save dashboard views
Reuse dashboards for repeated monitoring.
Share dashboards
Collaborate with analysts and responders.
Validate data sources
Ensure collectors send expected telemetry.
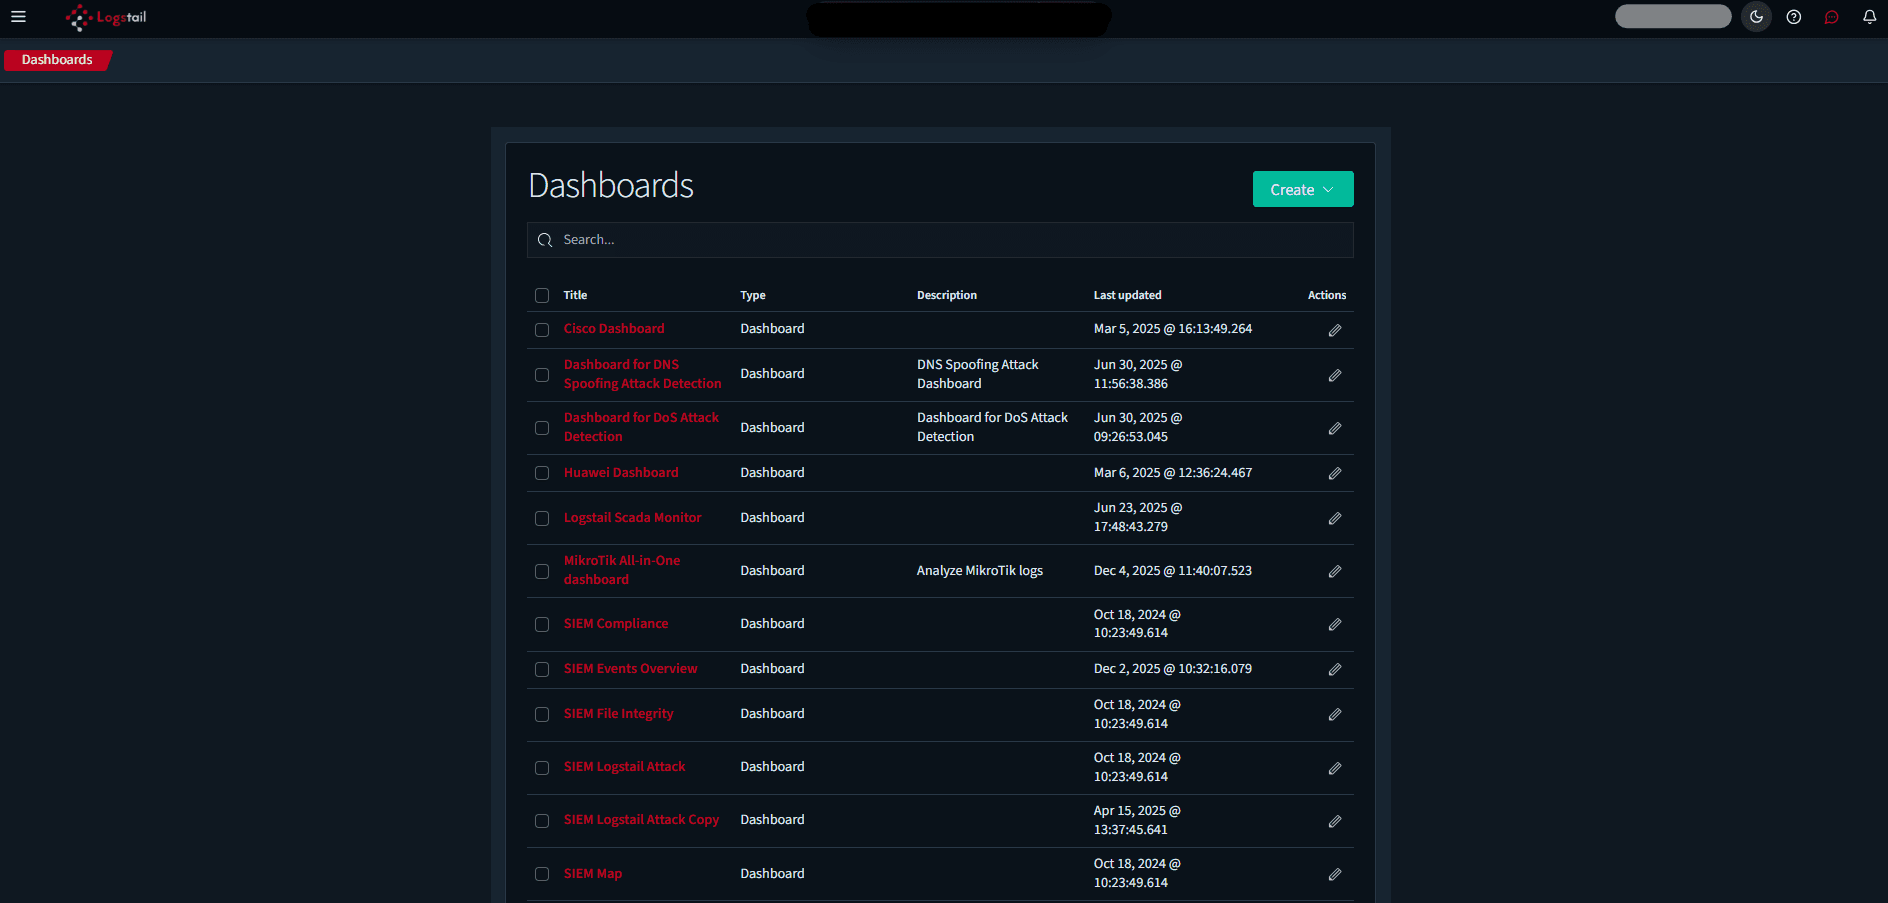
Main View
Dashboards open as a full-page embedded dashboarding application. The page lists available dashboards in a table.
The dashboard list includes:
The Create button is located in the top-right area of the Dashboards page.
Clicking Create opens a menu with these options:
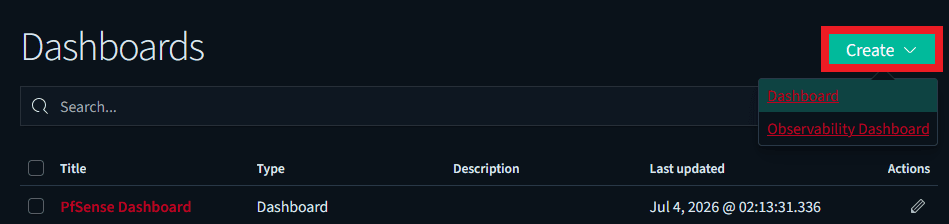
Use Dashboard to create a standard analytics dashboard.
Use Observability Dashboard when creating an observability-focused dashboard view.
Common Dashboard Content
Dashboards can include:
How to Use the Dashboards Page
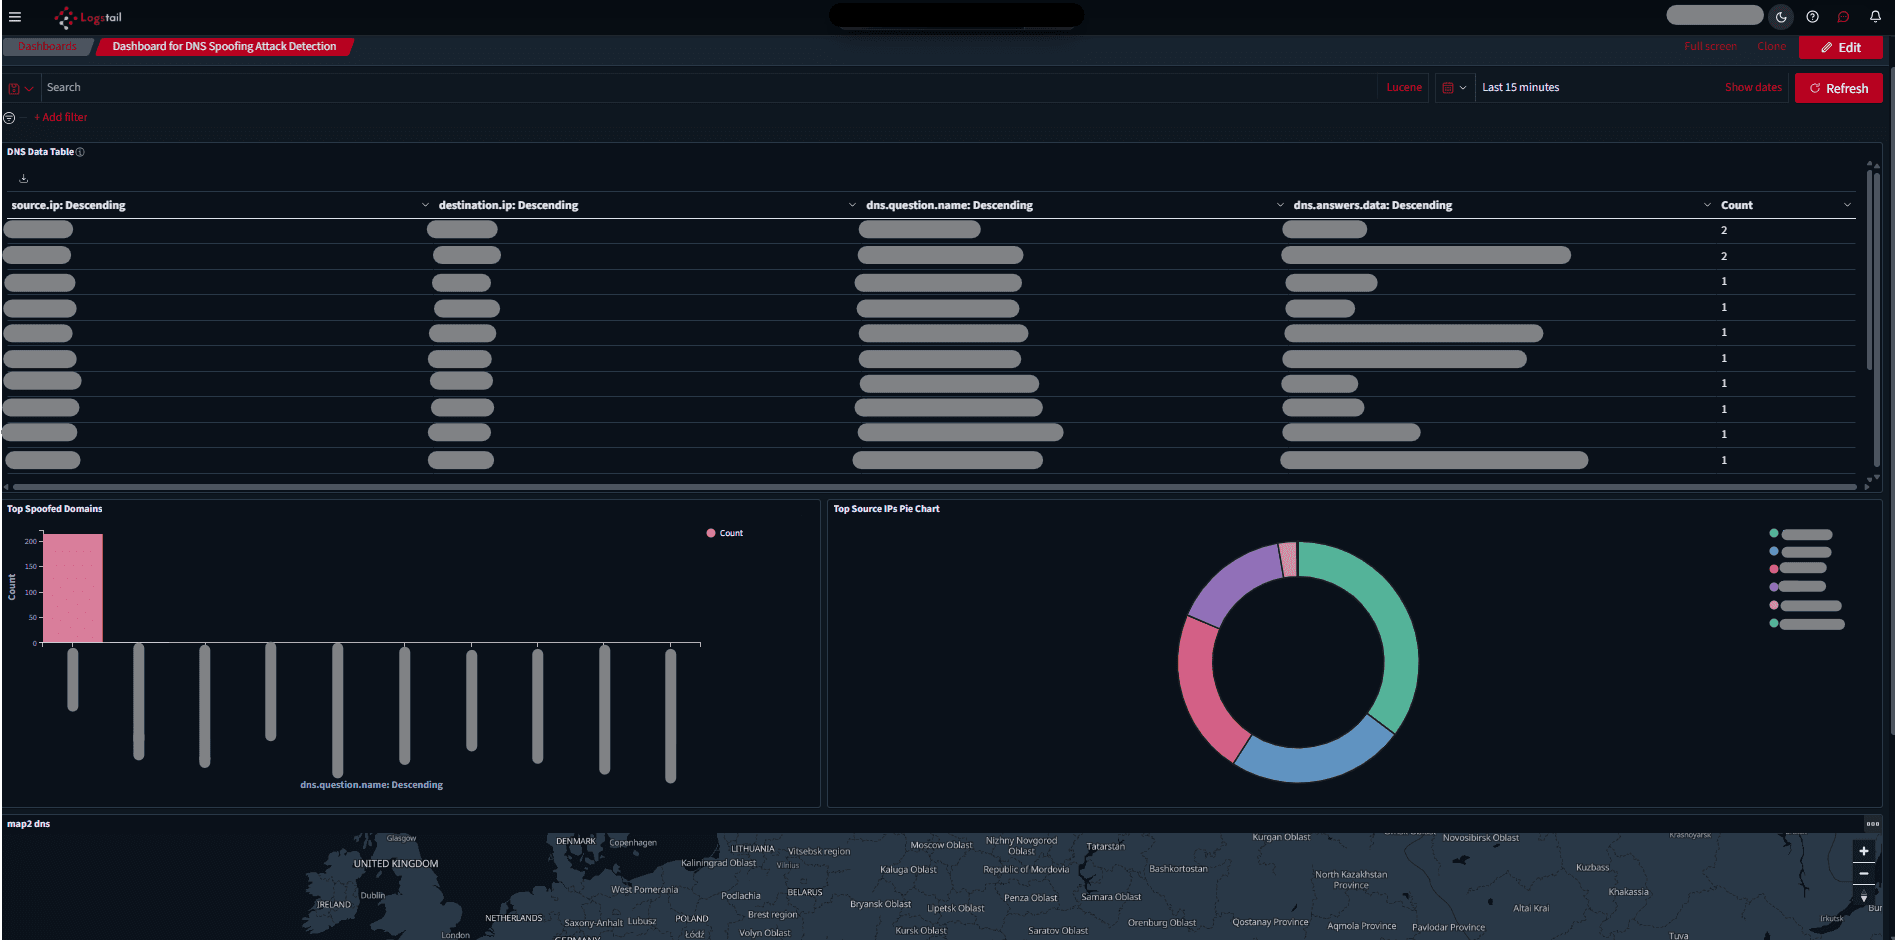
Create a Dashboard
Create an Observability Dashboard
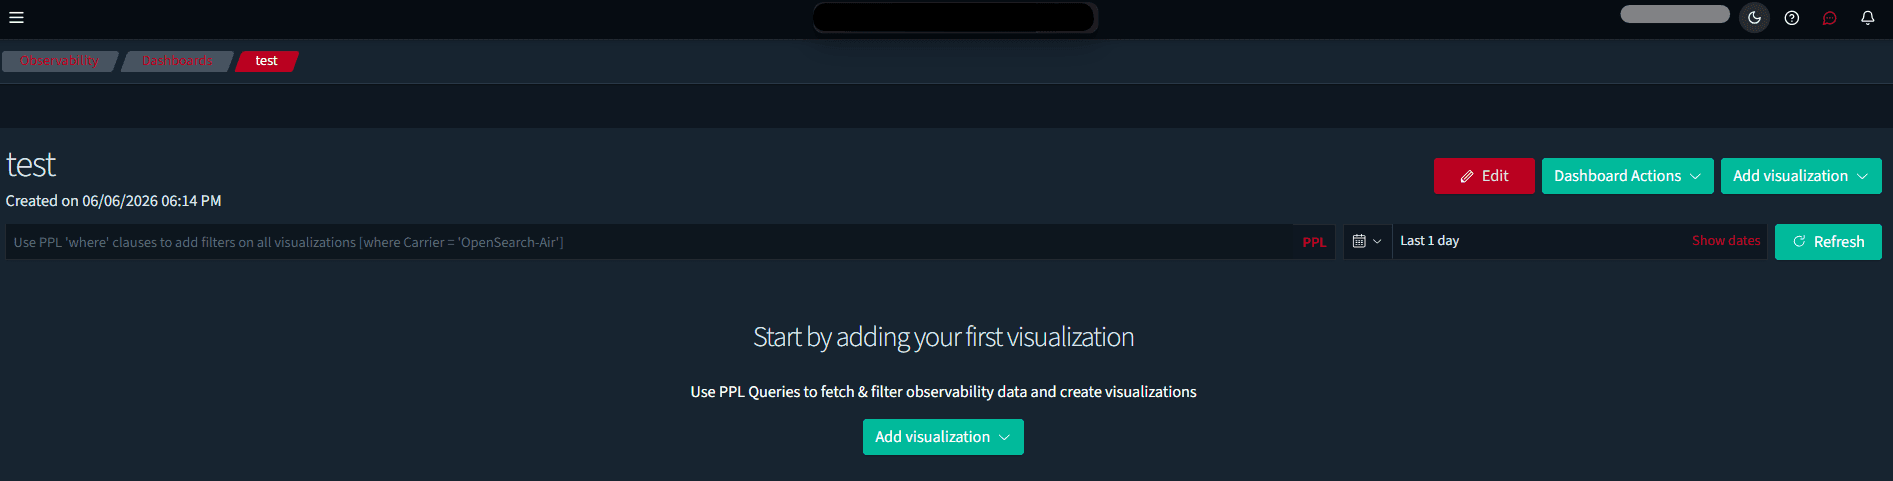
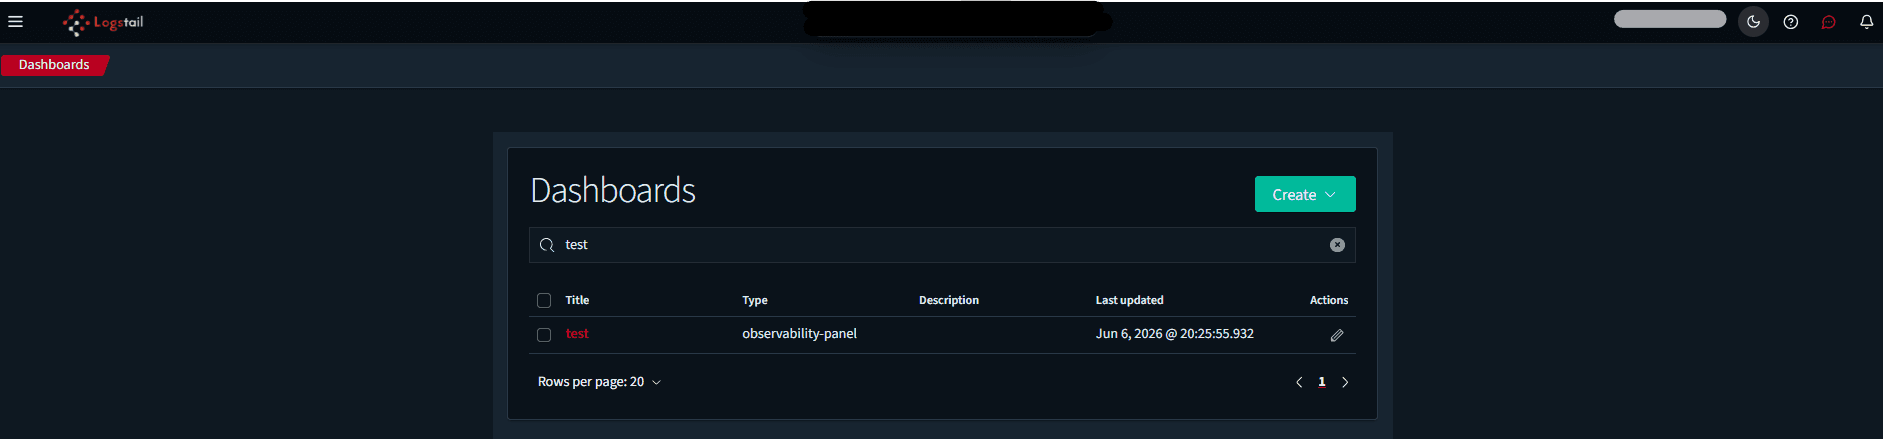
Use observability dashboards when the view is focused on operational telemetry, service behavior, infrastructure health, or observability-style monitoring.
Time Range and Refresh
Dashboard results depend on the selected time window. Before making a conclusion, confirm the time range matches the use case.
Use shorter windows for active incident response and wider windows for trends, reporting, and historical review.
Refresh the dashboard after changing filters, time range, or underlying data sources.
Working With Pre-Built Dashboards
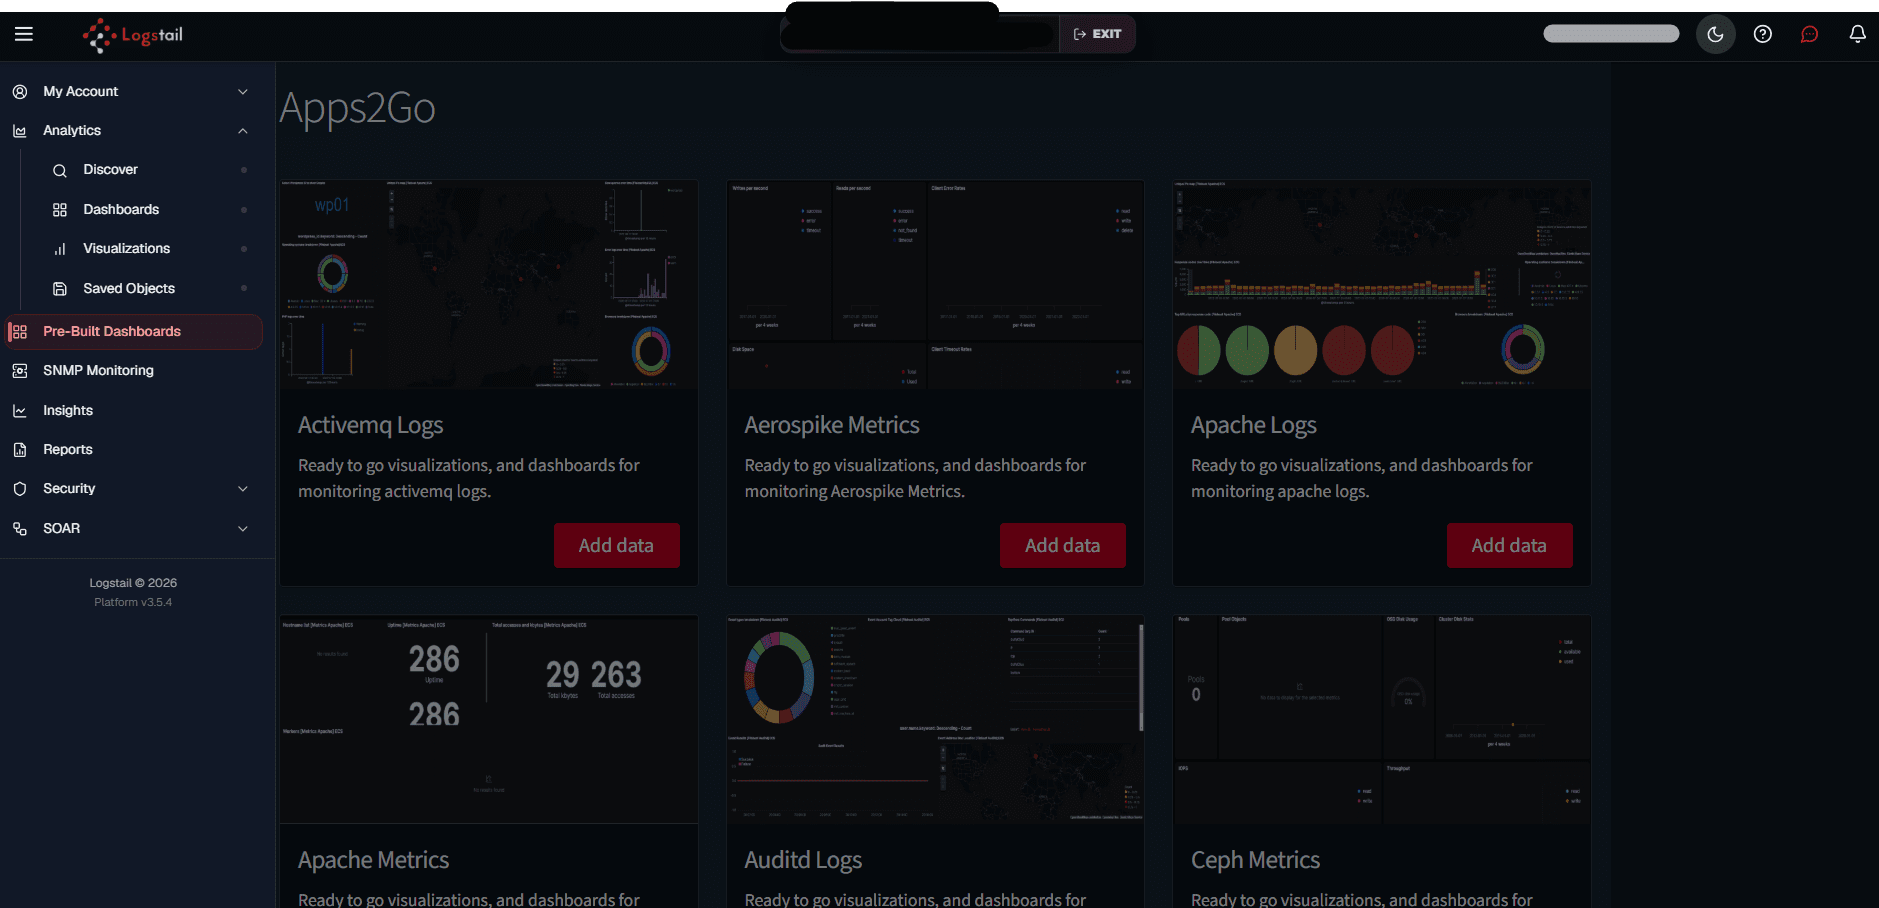
Pre-built dashboards help users start from known dashboard templates instead of creating every dashboard manually.
Pre-built dashboards are useful for common data sources such as Windows events, metrics, packets, SIEM telemetry, and other supported modules.
Operational Workflows
SOC Monitoring
Investigation Pivoting
Compliance Review
Environment Validation
Dashboard Hygiene
Dashboards are operational assets. Keep them clean and useful by:
Troubleshooting
Dashboard is empty
- 1
Check the selected time range, data source, and whether the required agents or collectors are sending data.
- 2
Confirm that the dashboard is using the correct index pattern.
- 3
Confirm that related saved objects still exist.
Dashboard panels show errors
- 1
The underlying saved objects, visualizations, index patterns, or fields may have changed.
- 2
Review related visualizations and saved objects.
Values look incorrect
- 1
Confirm the filters and time range.
- 2
Validate the raw events in Analytics → Discover.
Save option is not visible
- 1
The current user may not have permission to create or edit dashboards.
- 2
If the dashboard is pre-built or managed, create a copy before editing when the platform provides that option.
Shared dashboard does not open
- 1
Confirm that the recipient has access to the same Logstail stack, tenant, analytics space, and required permissions.
- 2
If the dashboard was shared through Saved Objects, confirm that related visualizations, saved searches, and index patterns were also imported or already exist.
Imported dashboard has missing panels
- 1
A dashboard can depend on visualizations, saved searches, maps, or index patterns.
- 2
Export and import related objects together when moving dashboards between environments.
Dashboard controls differ from this guide
- 1
Dashboards are embedded from the analytics application.
- 2
Some controls can vary by configuration or version.
Best Practices
Use dashboards for monitoring
Use dashboards for monitoring and trend detection.
Validate raw data
Use Analytics → Discover for raw event validation.
Keep dashboards focused
Keep dashboards focused on a specific use case.
Name dashboards clearly
Save dashboard views with clear names.
Control sharing
Share dashboard views only with users who need access.
Use saved objects
Use Saved Objects export and import for backup, migration, or reusable dashboard sharing.
Review accuracy
Review dashboard accuracy after data model changes.
Check dependencies
Confirm related visualizations and index patterns before deleting saved objects.
Backup dashboards
Use saved objects to back up or migrate important dashboard content.
Related Pages
| Page | Description |
|---|---|
| Pre-Built Dashboards | Install ready-made dashboards for supported collectors, modules, and data sources before opening them in Dashboards. |
| Discover | Validate the raw events behind dashboard panels and investigate the data shown in charts or tables. |
| Visualizations | Create or edit visual panels that can be added to dashboards. |
| Saved Objects | Export, import, back up, or migrate dashboard objects and related visualizations. |
| Logstail Agent | Install and configure endpoint collection so dashboards have data to display. |
| Reports | Generate report output from dashboards, saved searches, or analytics views. |