Insights
The Insights page provides anomaly detection for ingested data. It helps users detect unusual patterns, abnormal behavior, spikes, drops, and signals that may require investigation.
Users can create detectors, configure the data fields to monitor, preview detector behavior, and review anomaly results from the Insights workspace.
Where to find it
Open the main navigation menu and go to:
Navigation path
Application route
/insightsData source required
Insights can only detect anomalies when the selected data source contains ingested events and the detector is configured correctly.
What insights is used for
Use Insights to:
Detect anomalies
Identify unusual values, trends, or activity patterns in ingested data.
Create detectors
Configure anomaly detectors for selected data sources and fields.
Monitor behavior
Track data behavior over time and surface abnormal changes.
Preview detector output
Preview detector results before relying on the configuration.
Review anomaly results
Use detector results to identify activity that may need investigation.
Support investigations
Use anomaly signals as starting points for deeper analysis and threat hunting.
Main View
The Insights page opens the anomaly detection workspace. From this page, users can access the Insights overview, open dashboards, manage detectors, and create new detectors.
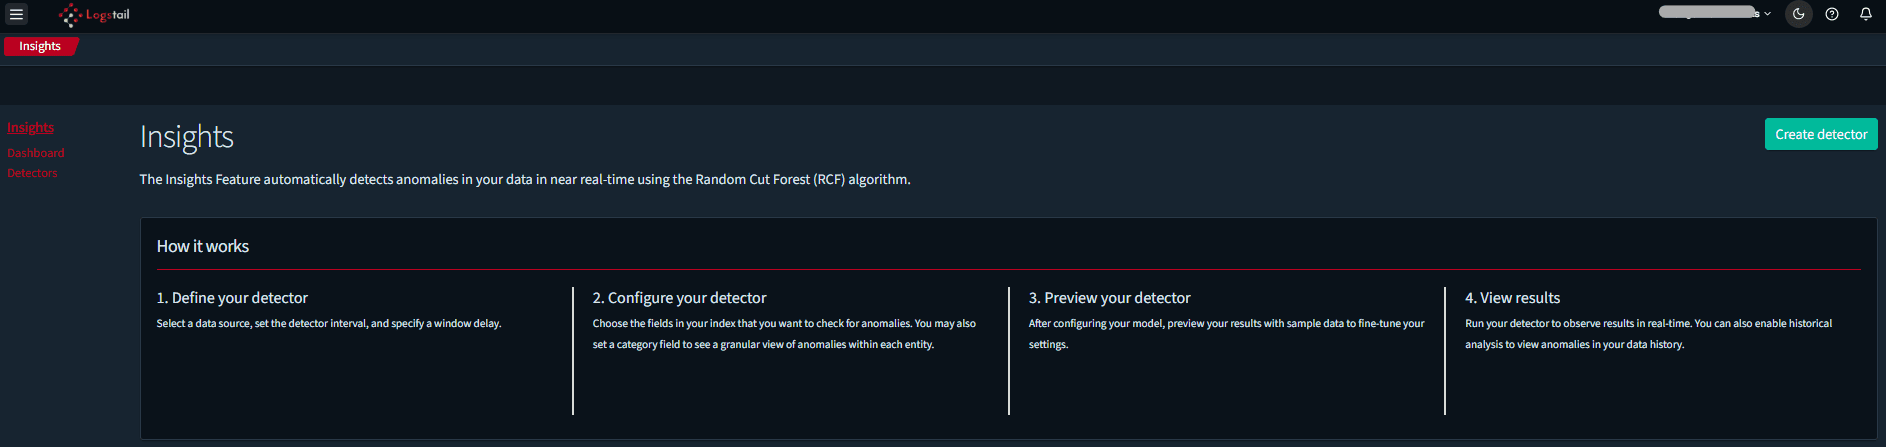
The main view includes:
Insights overview
Introduces how anomaly detection works and explains the detector setup flow.
Dashboard
Provides access to anomaly detection dashboards and visual result views.
Detectors
Shows configured detectors and allows users to manage detector definitions.
Create detector
Starts the workflow for creating a new anomaly detector.
How Insights Works
How Insights fits the SOC workflow
Insights helps security teams move from raw telemetry to higher-level observations.
Use it alongside:
Insights does not replace investigation. It helps highlight data that may deserve analyst attention.
Insight use cases
Detect Event Spikes
Identify sudden increases in event volume, authentication failures, network activity, or other telemetry using Insight spike views.
Review Anomalous Behavior
Use anomaly views to surface activity that deviates from historical or expected patterns across the environment.
Support Threat Hunting
Use Insights as a starting point for hunting suspicious activity, then pivot into Discover for raw event review and deeper investigation.
Validate Monitoring Coverage
Check whether expected telemetry is present and whether data patterns look normal for the environment, helping validate detection coverage.
Create a Detector
Detectors define what Insights should monitor for abnormal behavior.
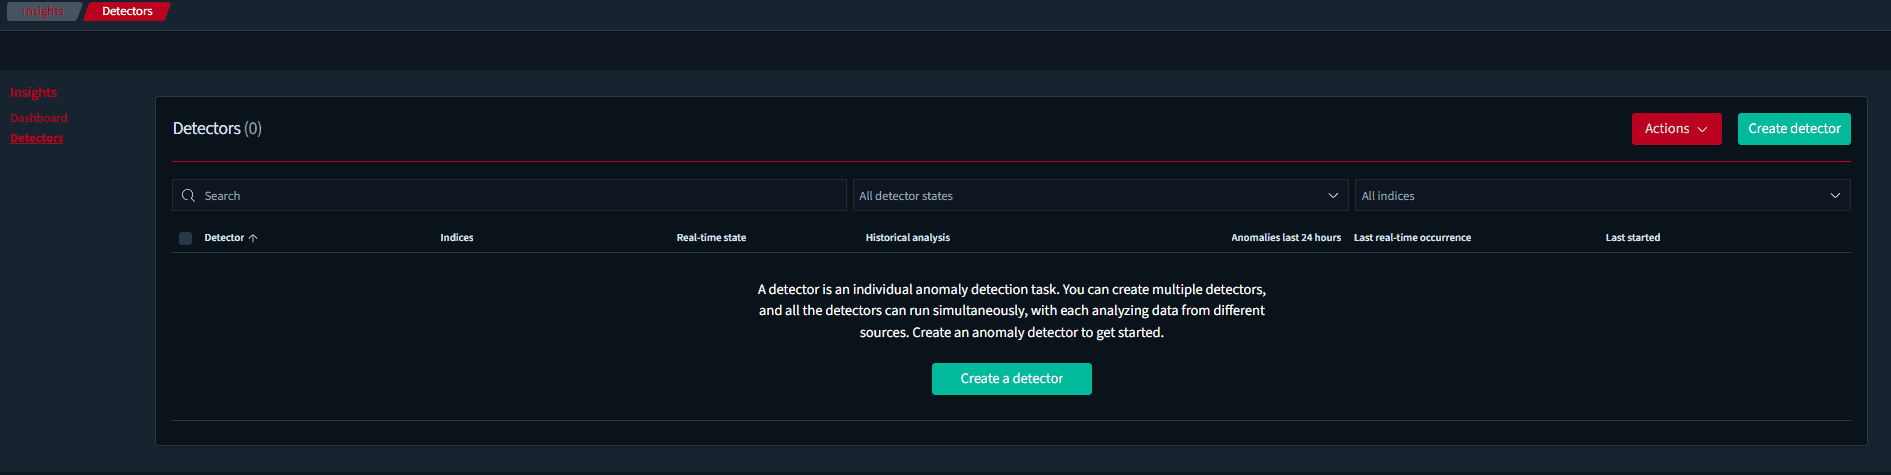
Use a detector when you want the platform to analyze a specific data source, field, metric, or pattern for anomalies.
Operational note
The left navigation in Insights helps users switch between Dashboard and Detectors. During detector creation, use the main form area to configure the detector. Avoid using the left navigation while filling out the form unless you want to leave the setup flow.
Detector Setup Fields
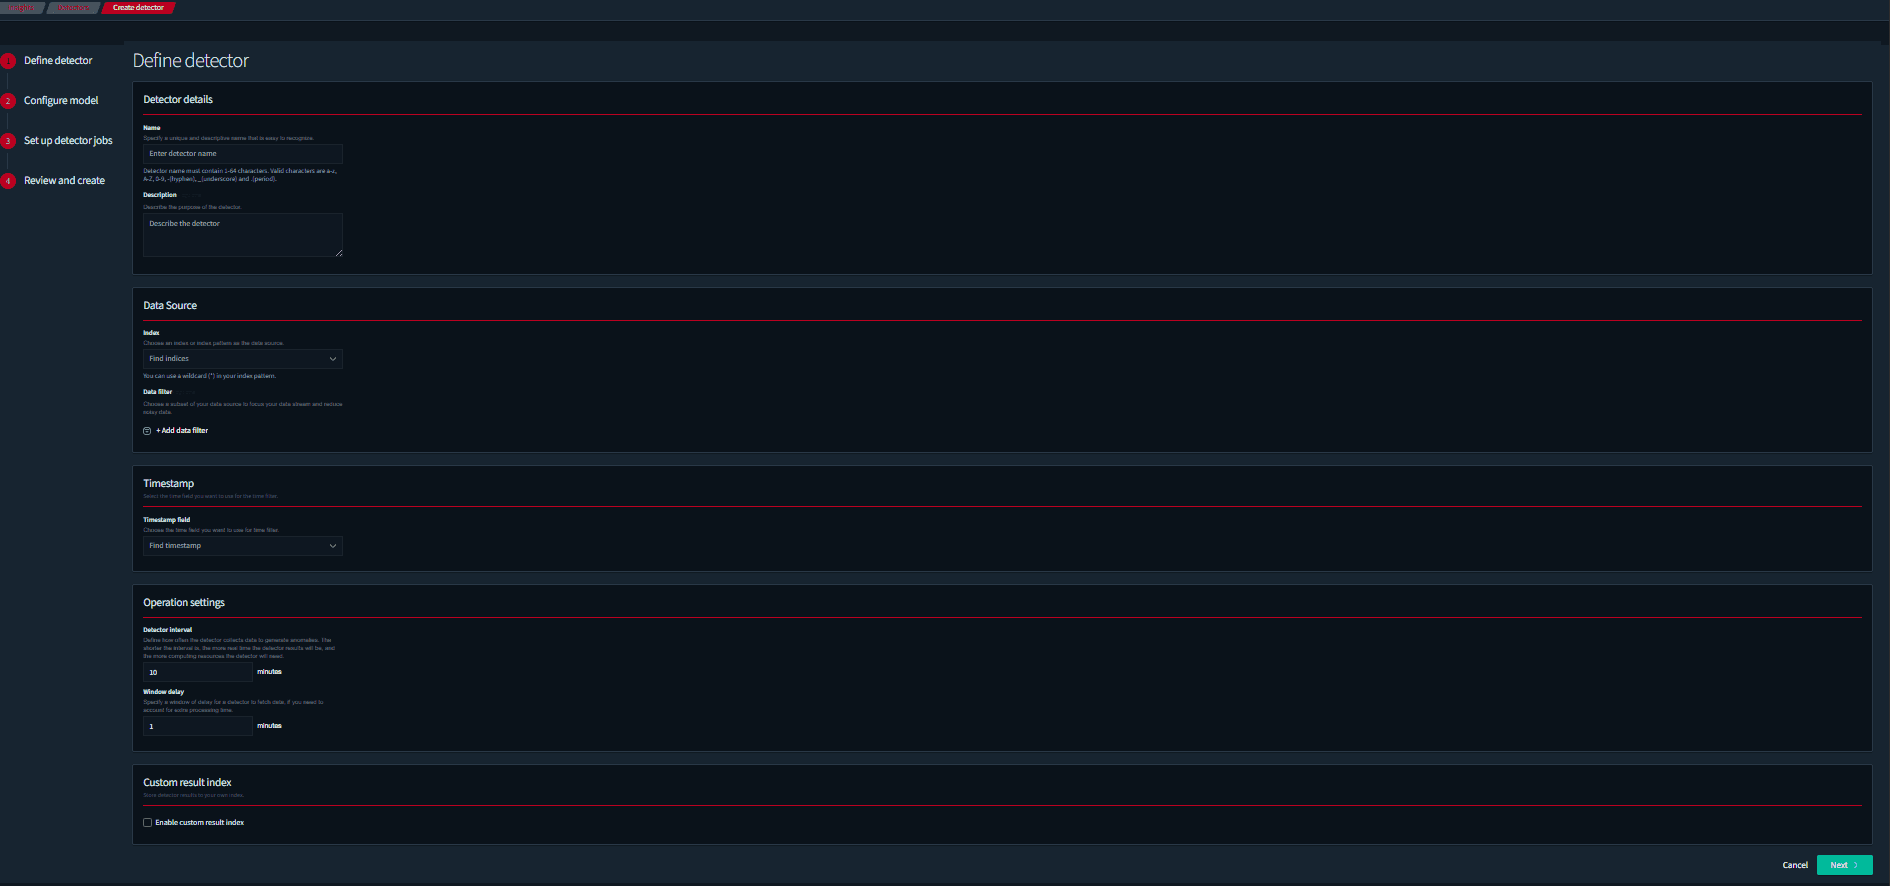
Detector Name
Enter a clear, descriptive name that reflects what the detector monitors. Examples include High CPU Usage Detector, Authentication Failure Spike Detector, Network Traffic Anomaly Detector, or MikroTik Log Anomaly Detector.
Description
Optional context explaining the detector’s purpose, the data source it monitors, or the investigation scenario it supports.
Data Source
Select the index or data source containing the events to analyze. Use wildcard patterns for broad coverage or specific index patterns for focused monitoring.
Data Filter
Optional filter to analyze only a subset of events, such as authentication logs, firewall logs, events from a specific host or device, or high‑priority telemetry.
Timestamp Field
Select the field used to order events over time. Most Logstail datasets use @timestamp. Required for time‑based anomaly detection.
Model configuration
The model defines what behavior should be analyzed.
A typical model configuration includes:
For example, to detect high CPU usage anomalies, users may select a CPU usage field (e.g. cpuUsage) and use an aggregation such as max.
You can add more features depending on the use case.
Set Up Detector Jobs
Detector jobs control how and when analysis runs.
Options include:
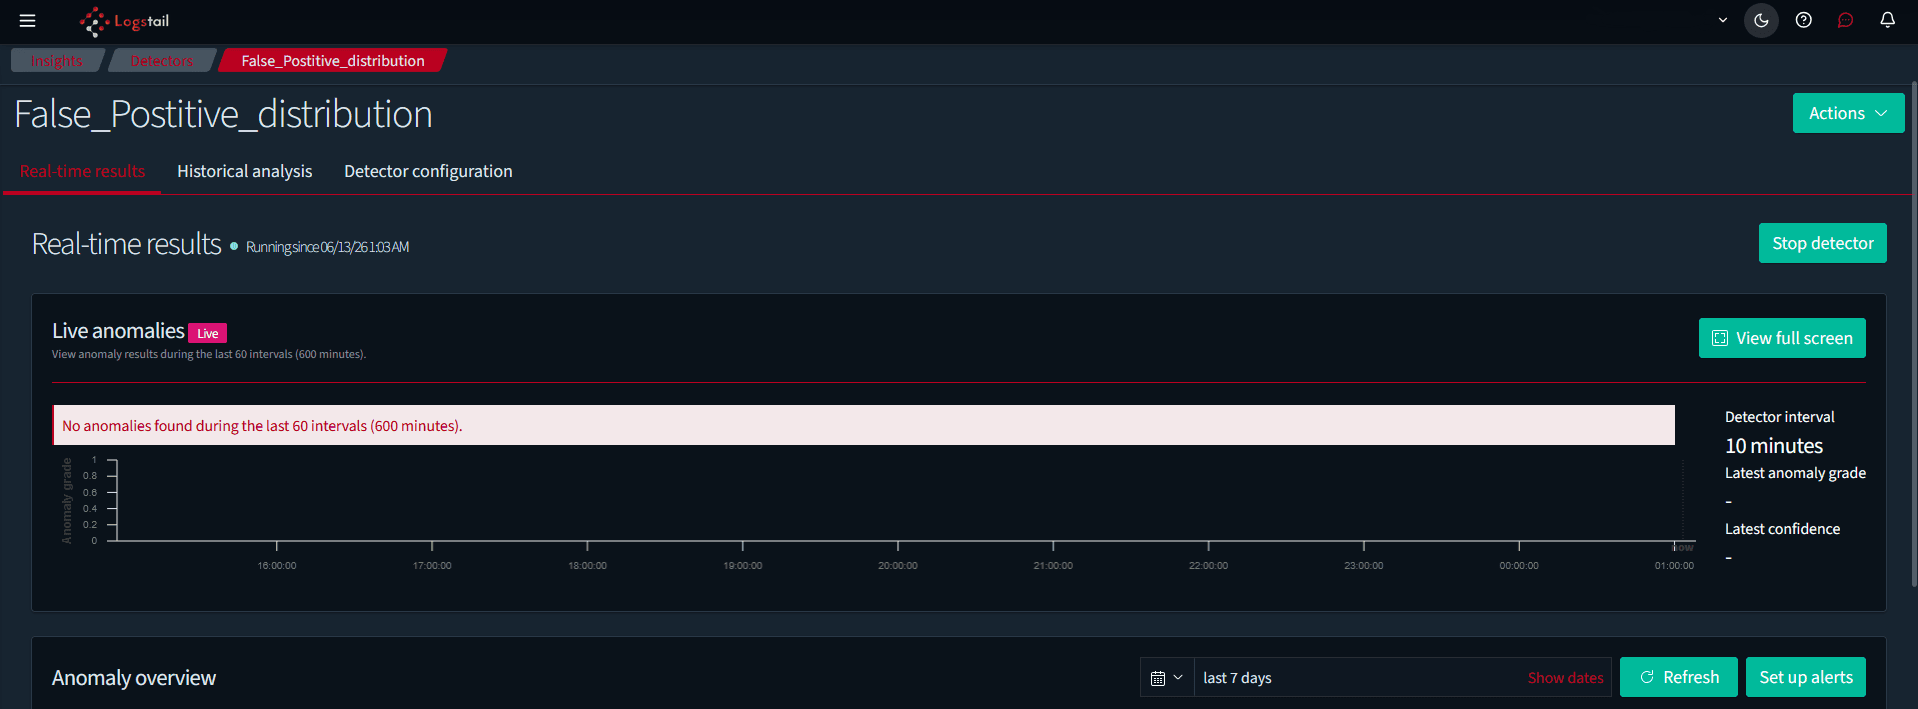
After Creating a Detector
| Area | Description |
|---|---|
| Real-time results | Shows anomalies detected in real time. |
| Historical analysis | Displays analysis results for historical data. |
| Detector configuration | Allows users to review or edit detector settings. |
Reviewing Insight Results
When users open a detector, they can review a graphical summary of detected anomalies across the selected time range.
Investigation Workflow
Investigation Signals
Troubleshooting
Insights page is empty
- 1
Check whether the required data source exists.
- 2
Verify that detectors or insight dashboards are configured.
Create detector is not visible
- 1
Confirm that the embedded Insights view is fully loaded.
- 2
If still missing, use the left navigation to find the detector area.
- 3
The user may not have permission to create detectors.
No anomalies are shown
- 1
The selected time range may not contain abnormal activity.
- 2
Detectors may not be configured or enabled.
- 3
Confirm that the data source contains matching events.
Detector results look noisy
- 1
Tune the detector scope, filters, fields, aggregation method, or time window.
Detector does not analyze expected data
- 1
Check the selected data source, filter, timestamp field, and analysis field.
- 2
Confirm that the index contains data for the selected time range.
Insight cannot be validated
- 1
Use Analytics → Discover to inspect raw events.
- 2
If raw data is missing, check agent, collector, and index configuration.
Embedded controls differ from this guide
- 1
Insights is an embedded analytics page, so controls may vary by backend configuration.
- 2
Use the visible labels in the interface as the source of truth.
Best Practices
Use Insights as a starting point
Treat anomalies as signals, not conclusions.
Validate findings in Discover
Always confirm anomalies using raw event data.
Use clear detector names
Name detectors so their purpose is immediately understood.
Select correct data source
Ensure the detector analyzes the intended index and timestamp field.
Use filters to reduce noise
Narrow the dataset to improve anomaly quality.
Tune detectors regularly
Adjust configuration to reduce false positives.
Review anomalies regularly
Monitor detector output as part of SOC routines.
Document findings in cases
Record confirmed anomalies for investigation tracking.
Use reports for summaries
Generate recurring insight summaries for visibility.
Compare trends with dashboards
Cross-check anomalies with dashboards and SOAR alerts.