
All Findings
The All Findings page provides the full technical evidence view for a specific completed EASM scan. It helps users inspect DNS records, detected technologies, subdomains, open ports, TLS/SSL details, WAF checks, security headers, passive reconnaissance, WHOIS data, directories, and other scan evidence from one centralized view.
Where to Find It
Open the EASM navigation and go to:
Open the EASM navigation and go to:
Navigation path
What This Page Is Used For
Use All Findings to:
Review exposure issues
Review every discovered exposure issue.
Identify priority risks
Identify high-priority risks within the completed scan.
Compare with previous scans
Use the evidence view alongside historical results to understand whether exposure is recurring.
Investigate affected assets
Investigate affected domains, IPs, services, and web assets.
Switch evidence views
Use Masonry or Grid view to change how evidence cards are displayed.
Review by category
Use category pills to focus on DNS, technologies, TLS, WAF, open ports, and other evidence types.
Return to summary
Use Back to Results to return to the Scan Results dashboard.
Main Page Purpose
The Scan Results page provides the dashboard summary for one completed scan. The All Findings page provides the deeper technical evidence view for that same scan.
Use All Findings when you need to inspect the raw discovery context behind the Scan Results dashboard.
What DNS records were found?
Review A, AAAA, MX, NS, TXT, CNAME, and SOA records discovered for the target.
Which technologies were detected?
Review detected headers, web server behavior, CMS signals, and component evidence.
Which subdomains are in scope?
Review discovered in-scope subdomains and related out-of-scope hosts.
Which ports are open?
Inspect open ports, services, products, versions, and scan reasons by host.
Is TLS or WAF evidence present?
Review TLS/SSL, WAF, security header, and web protection evidence.
What needs deeper validation?
Use the technical evidence cards to validate exposure before remediation or escalation.
Technical Evidence View
The main view is a category-based technical evidence dashboard. Each section shows a different type of scan evidence for the completed target.
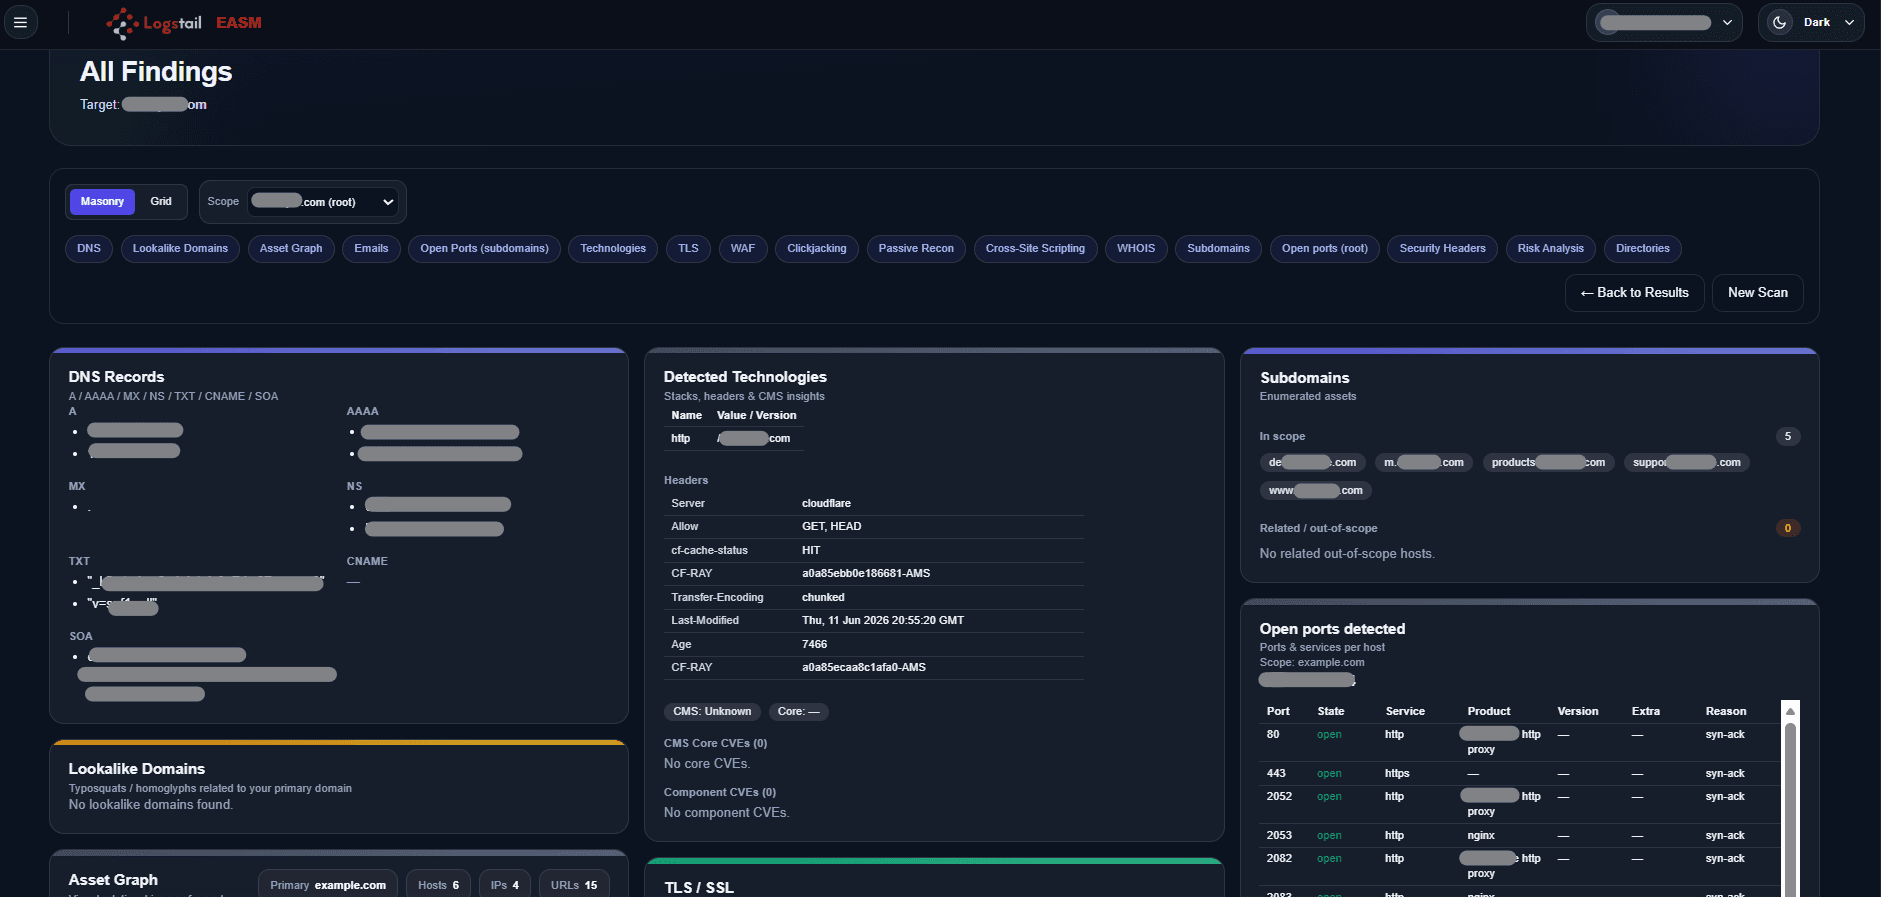
The page includes category filters and evidence cards for:
Key Evidence Areas
The All Findings view is organized into evidence cards. Each card represents one type of scan output for the selected target.
Common cards include:
DNS Records
Shows discovered DNS records such as A, AAAA, MX, NS, TXT, CNAME, and SOA.
Detected Technologies
Shows detected web technologies, server headers, CMS signals, and component evidence.
Subdomains
Shows in-scope subdomains and related out-of-scope hosts discovered during the scan.
Open ports detected
Shows open ports, services, products, versions, and scan reasons for the selected target.
Lookalike Domains
Shows possible typosquatting or homograph domains related to the primary domain.
TLS / SSL
Shows TLS or SSL evidence, certificate posture, and encryption-related observations.
Navigation and Filters
Use the controls at the top of the page to switch between evidence categories and change how results are displayed.
The page may include:
Category filters help users create a view with only the desired findings category they want to see.
Common Page Workflows
Troubleshooting
No findings appear
- 1
Confirm scans have completed.
- 2
Confirm filters are not hiding results.
A finding looks outdated
- 1
Re-run the scan to confirm whether the exposure still exists.
Expected evidence card is not visible
- 1
Check the selected category filter.
- 2
Switch between Masonry and Grid view.
- 3
Confirm the selected scope.
- 4
Return to Scan Results and reopen See all.
Open ports list is hard to review
- 1
Use the Open Ports category pill.
- 2
Switch to Grid view if the Masonry layout is difficult to scan.
- 3
Use the table scrollbar to review additional port rows.
Best Practices
Confirm scope first
Use the Scope selector before reviewing evidence.
Use category filters
Open only the evidence category you need to reduce visual noise.
Check open ports carefully
Review open ports, services, products, and scan reasons before escalating exposure.
Compare evidence types
Use DNS, subdomains, technologies, TLS, WAF, and headers together for better context.
Return to summary
Use Back to Results when you need the Scan Results dashboard view.
Use reports for handoff
Use Detailed PDFs from Reports when teams need a formal technical handoff.