SOAR Monitors
The SOAR Monitors page is where users manage alerting rules that continuously evaluate Logstail data sources for security events, operational issues, thresholds, and suspicious activity.
A monitor runs on a defined schedule, evaluates configured logic, and generates alerts when conditions are met.
Monitors are a core part of proactive detection. Instead of manually searching logs, teams can automate detection and maintain consistent alert coverage.
Where to find it
Open the main navigation menu and go to:
Navigation path
Application route
/monitorsPage Overview
The Monitors page provides a centralized view of all configured rules and their operational state.
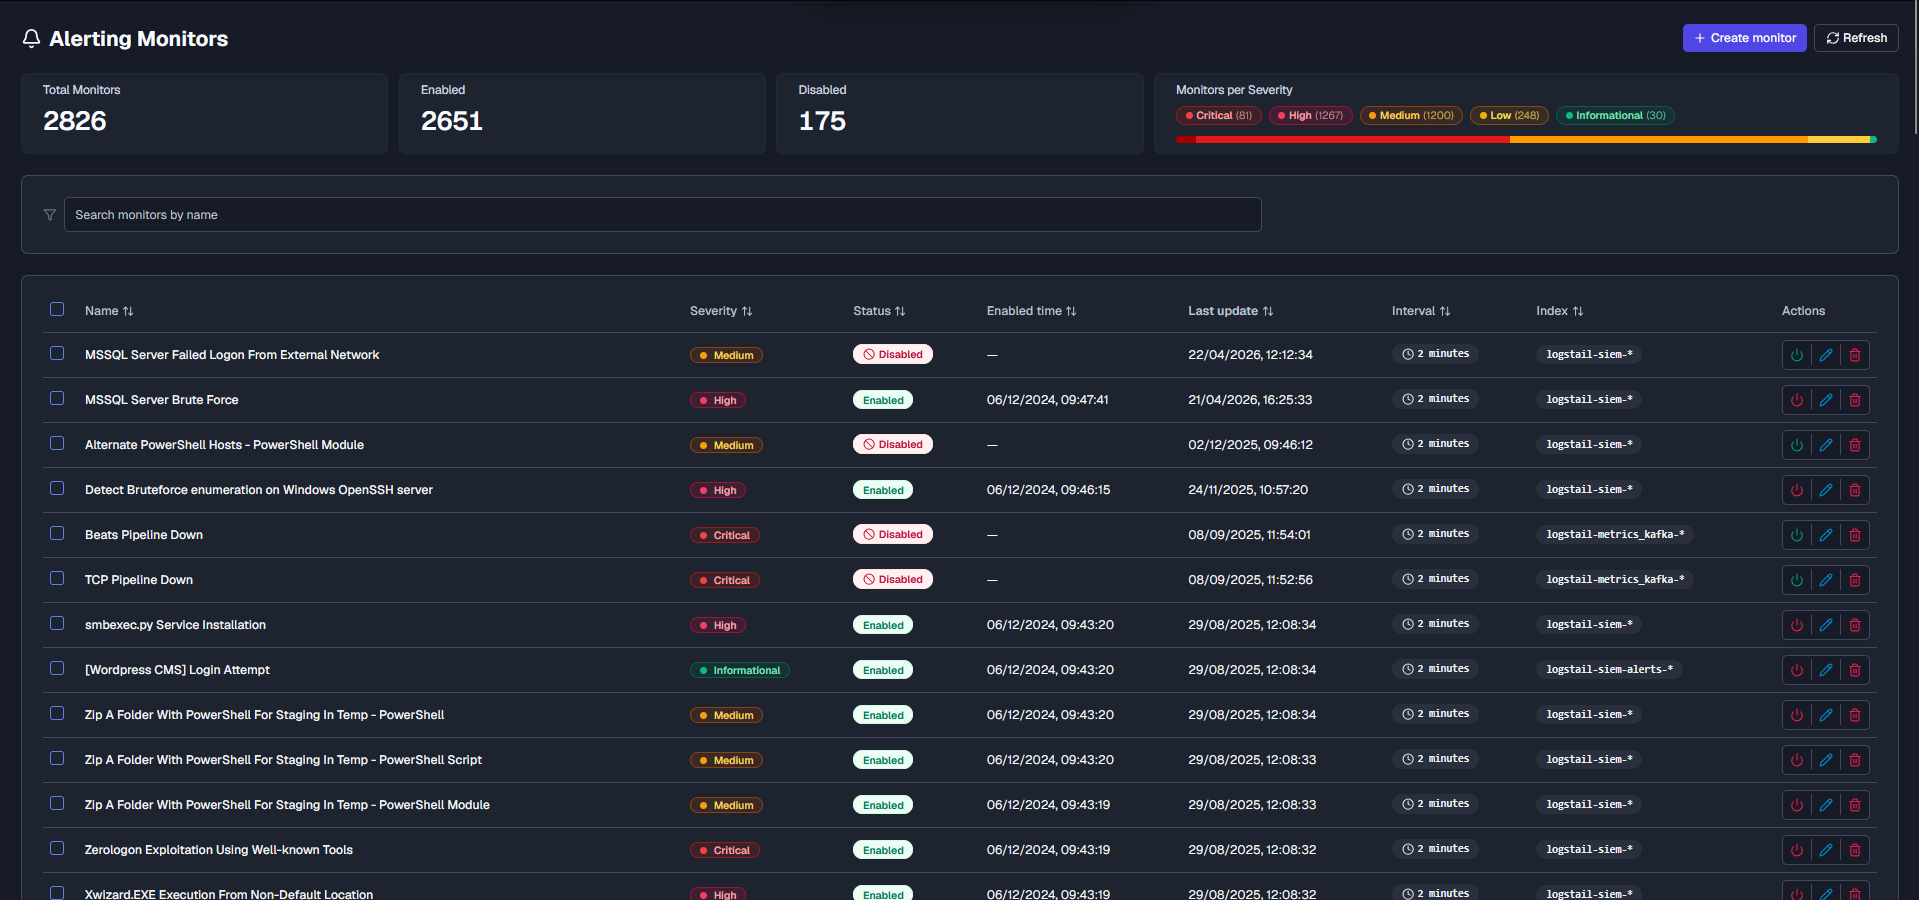
The page includes:
What this page is used for
Use monitors to automate detection workflows and continuously evaluate your data.
Detect security events
Identify suspicious or malicious activity automatically.
Monitor system health
Track operational issues and system thresholds.
Reduce manual work
Convert repeated searches into scheduled detections.
Generate alerts
Trigger alerts when conditions are met.
Notify teams
Send alerts via configured channels.
Maintain coverage
Ensure detections run consistently across environments.
Who uses this page
The SOAR Monitors page is designed for security operations workflows, especially for:
SOC Engineers
Maintain detection logic, validate the telemetry, and support alert workflows.
Senior Analysts
Review escalated alerts and guide investigation quality by tuning and managing alert monitoring.
Administrators
Manage configuration, access, and operational settings for the page.
Incident Response Teams
Investigate threats, confirm malicious activity, and coordinate the response.
Detection Engineers
Tune alert detections, validate rule performance, and monitor signal quality.
How Monitors work
A monitor follows a simple detection lifecycle:
Summary Cards
The summary cards provide a quick overview of monitor coverage and status.
Total Monitors
Shows the total number of configured monitors.
Enabled
Monitors that are actively running.
Disabled
Monitors that are saved but inactive.
Monitors per Severity
The severity chart shows how monitors are distributed by priority.
Use this chart to validate whether detection coverage aligns with operational priorities.
Monitors Table
The monitors table lists all configured rules and their details.
Monitor Status
Enabled
An enabled monitor runs continuously and generates alerts when logic matches.
Disabled
A disabled monitor is saved but inactive.
When to disable
Disable monitors during tuning, maintenance, or temporary suppression instead of deleting them.
Row Actions
Enable / Disable
Toggle monitor execution state.
Edit
Modify monitor configuration and logic.
Delete
Remove monitors permanently.
Create a Monitor
Use Create Monitor to build a new detection rule.
The creation page allows you to configure all aspects of the monitor.
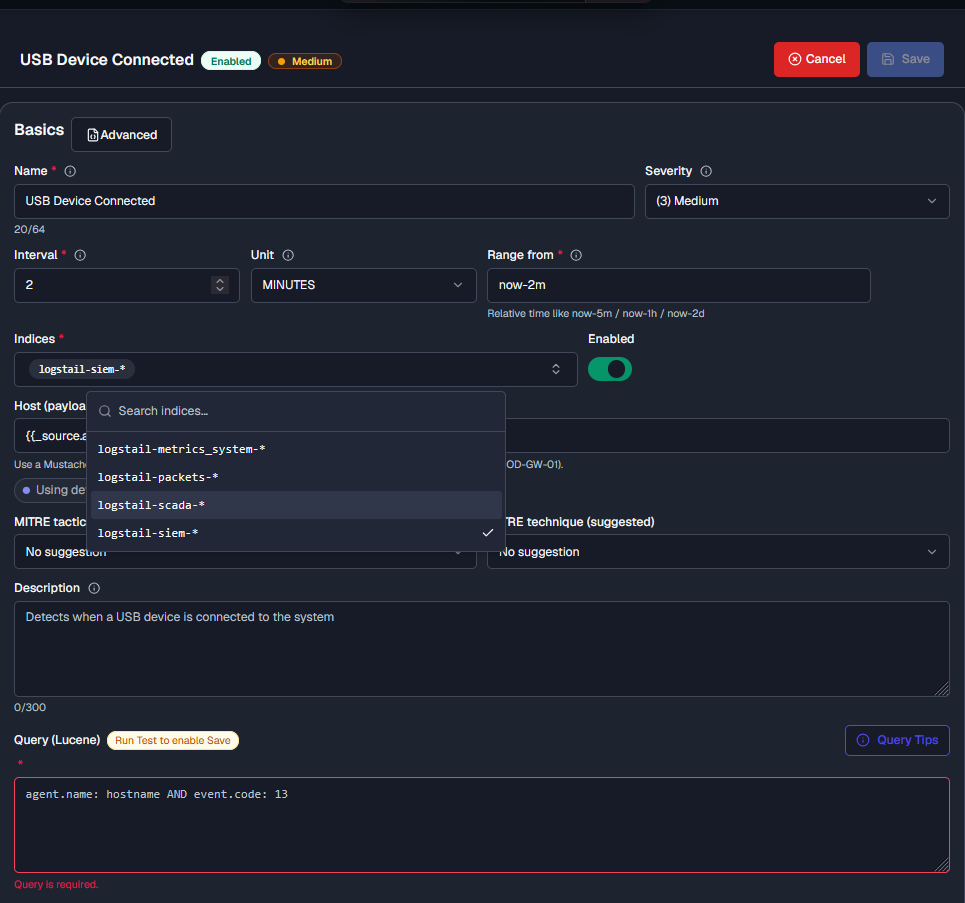
Monitor Creation
Basics Tab
The Basics tab contains the main configuration fields.
Monitor Configuration Fields
| Field | Purpose |
|---|---|
| Name | Identifies the monitor in the table, alerts, reports, and investigation workflows. |
| Severity | Defines the priority of alerts generated by the monitor. |
| Schedule interval | Controls how often the monitor evaluates data. |
| Time range | Defines how far back the monitor searches during each execution. |
| Data source / index | Selects the dataset the monitor evaluates. |
| Query logic | Defines which events or records should match the monitor. |
| Trigger logic | Defines when a matched condition should generate an alert. |
| MITRE mapping | Adds ATT&CK context to generated alerts when relevant. |
| Notifications | Controls whether alerts are sent to configured notification channels. |
Advanced Tab
Use advanced mode for complex configurations.
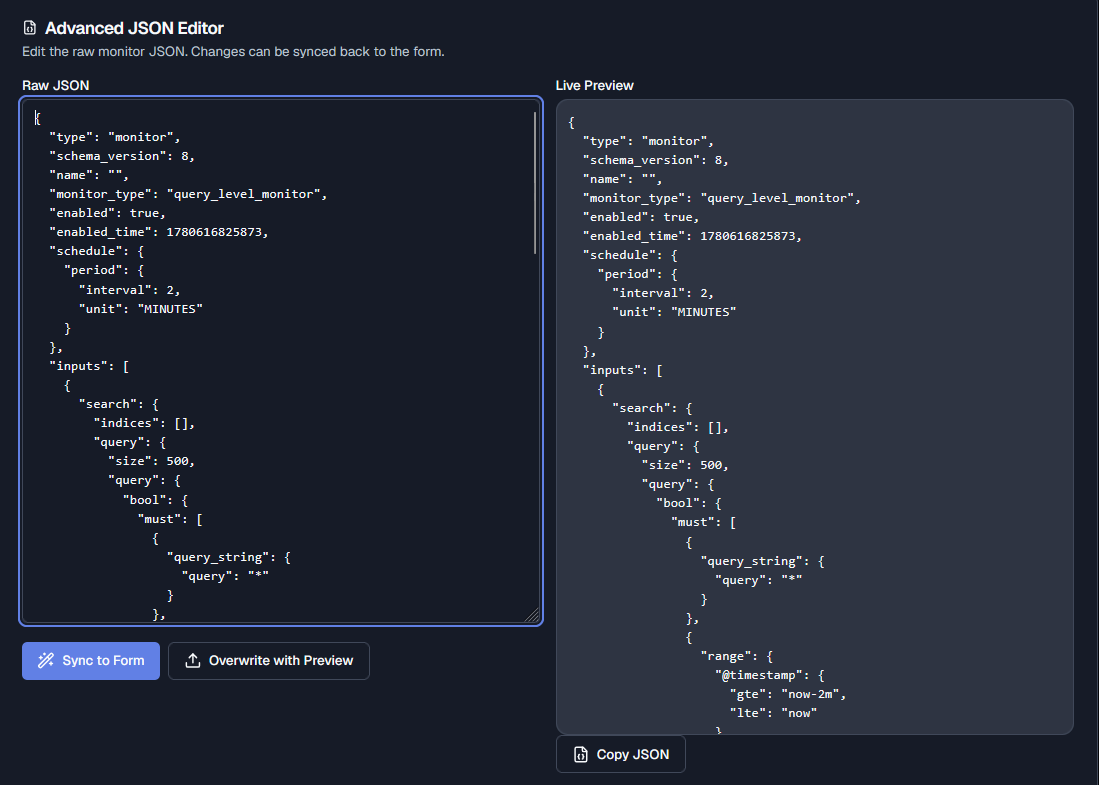
Advanced usage warning
Incorrect JSON or field configuration may break monitor functionality.
When to Create a Monitor
Create a monitor when a condition should be evaluated repeatedly without manual searching.
Repeated detection need
Create a monitor when analysts repeatedly search for the same activity.
High-risk behavior
Create a monitor for behavior that should generate alerts when observed.
Threshold tracking
Create a monitor for event volume, error rates, failures, or other threshold-based conditions.
Coverage requirement
Create a monitor when a detection must run continuously across an environment.
Compliance evidence
Create a monitor when recurring detection coverage must be shown during review.
Operational alerting
Create a monitor when teams need notification for recurring operational issues.
Create Monitor Workflow
Test Query
Use Test Query before saving to validate detection logic.
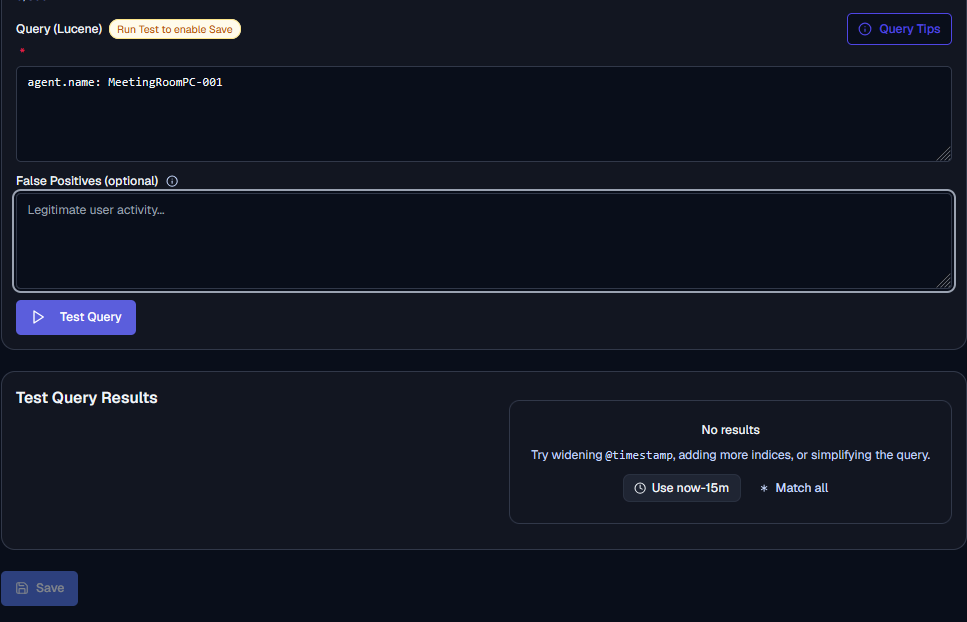
Make sure that:
Monitor Lifecycle
Monitor Lifecycle
| Stage | Description |
|---|---|
| Draft / creation | The monitor is being configured and tested before use. |
| Enabled | The monitor is active and evaluates data on its configured schedule. |
| Tuning | The monitor logic, severity, interval, or threshold is adjusted to reduce noise or missed detections. |
| Disabled | The monitor is saved but not currently running. |
| Deleted | The monitor is permanently removed and no longer available. |
Bulk Actions & Management
By selecting monitors through their checkbox column on the left, you can perform bulk actions.
Typical Workflow
Troubleshooting
Monitor returns no results
- 1
Check that the selected time range contains matching data.
- 2
Validate the selected index or data source.
- 3
Test the query in Discover.
- 4
Simplify the query logic and add conditions back one at a time.
- 5
Confirm field names and values match the ingested data.
Monitor is not generating alerts
- 1
Confirm the monitor is enabled.
- 2
Check the schedule interval and last execution time.
- 3
Verify matching data exists in the selected time range.
- 4
Review trigger logic and thresholds.
- 5
Confirm notification settings if alerts exist but no notifications are sent.
Too many alerts
- 1
Refine query logic to reduce broad matches.
- 2
Increase thresholds where appropriate.
- 3
Adjust the monitor interval or time range.
- 4
Add filters for known benign activity.
- 5
Review severity so noisy detections do not appear more critical than they are.
Query syntax fails
- 1
Check Lucene syntax and special characters.
- 2
Confirm field names exist in the selected data source.
- 3
Test a smaller query first.
- 4
Use Query Tips if available before saving the monitor.
Best Practices
Use clear names
Describe detection behavior precisely for consistency, auditing and reusability.
Validate queries
Test your queries in the Discover app first.
Tune severity
Adjust thresholds and rules after real usage and feedback.
Avoid noisy rules
Prevent alert fatigue.
Avoid narrow logic
Prevent missed detections.
Review regularly
Maintain detection quality and keep it clean.