Scan Results
The Scan Results page provides a dashboard-style summary of a completed EASM scan. It helps users review discovered assets, open ports, TLS/SSL status, security issue distribution, portfolio level, issue sources, and top issues for a specific target.
For deeper technical evidence, use See all to open the All Findings page.
Where to Find It
Open a completed scan from:
Open a completed scan for dashboards and visual representation.
Navigation path
or from:
Open completed scan reports for the PDF report version.
Navigation path
Reports page
Use the Reports page when you need downloadable PDF versions of completed scan results. The Reports page explains C-Level PDFs, Detailed PDFs, report selection guidance, historical report lookup, and report download workflows.
Then select the available action to view the scan result.
What This Page Is Used For
Use Scan Results to:
Review scan summary
Review the high-level outcome of a completed scan.
Check subdomains
Review the number of discovered subdomains for the target.
Review open ports
Check the number of open ports and the number of scanned hosts.
Check TLS/SSL status
Confirm whether TLS/SSL evidence was detected for the scanned target.
Review security issues
Review the issue distribution by severity level.
Review portfolio level
Review the current security rating and score for the completed scan.
Review issue sources
See whether issues come from CVEs, headers, open ports, or other sources.
Review top issues
Check the highest-priority detected issues before opening deeper findings.
Open All Findings
Use See all to open the full technical findings view.
Main Page Purpose
The Scan Results page is the visual summary view for one completed assessment. It helps users quickly understand scan outcome, discovered subdomains, open ports, TLS/SSL status, security issue distribution, portfolio level, issue sources, and top issues before moving into deeper technical review.
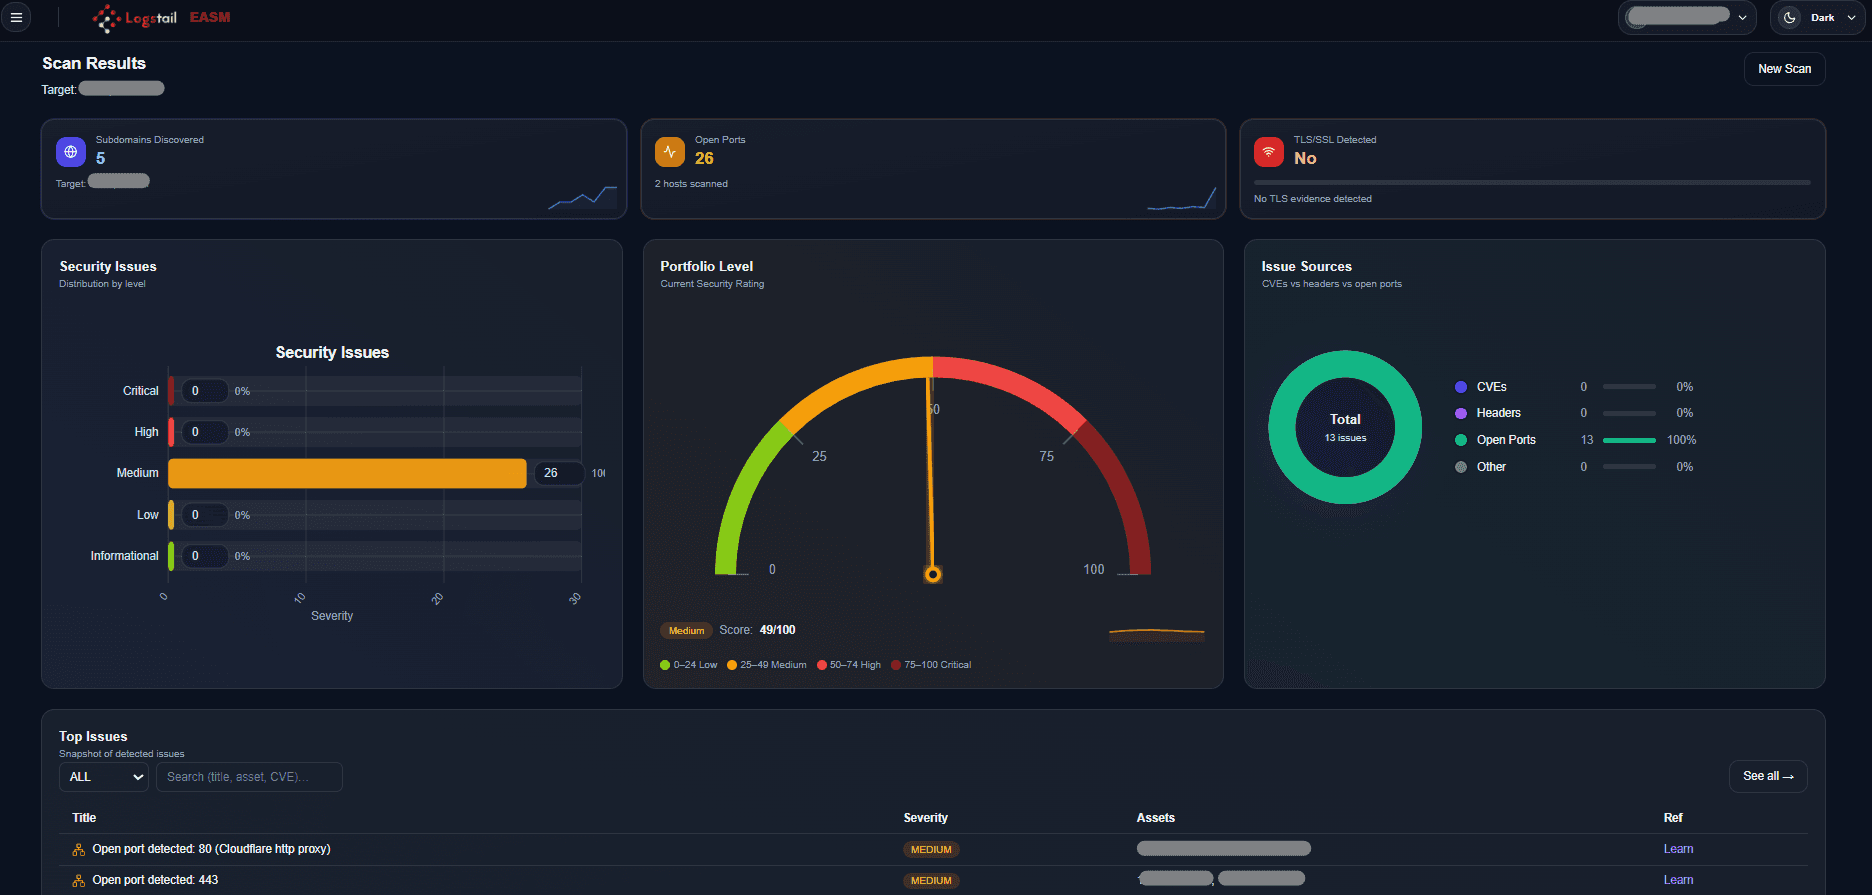
Use See all to open the All Findings page when you need full technical evidence.
Scan Results vs All Findings
Dashboard summary vs technical evidence
Scan Results shows the dashboard summary for one completed scan, including Subdomains Discovered, Open Ports, TLS/SSL Detected, Security Issues, Portfolio Level, Issue Sources, and Top Issues. All Findings provides the deeper technical evidence view with DNS records, detected technologies, subdomains, open ports, TLS/SSL details, WAF checks, security headers, passive reconnaissance, WHOIS data, and directories.
Subdomains Discovered
The Subdomains Discovered card shows how many subdomains were found for the scanned target.
Use this card to quickly understand whether the scan discovered additional externally visible names related to the target.
Open Ports
The Open Ports card shows the number of publicly reachable ports detected during the scan.
It may also show how many hosts were scanned. Open ports represent reachable external services and should be reviewed to confirm they are expected.
TLS/SSL Detected
The TLS/SSL Detected card shows whether TLS or SSL evidence was detected.
Use this card to quickly confirm whether encrypted services were identified. If no TLS evidence is detected, review the target and open services to confirm whether HTTPS or TLS should be present.
Security Issues
The Security Issues chart shows the distribution of detected issues by severity level.
Severity levels may include:
Use this chart to understand the overall issue breakdown before reviewing specific findings.
Portfolio Level
The Portfolio Level panel shows the current security rating for the completed scan.
The score helps summarize the scan’s external exposure level. Treat it as a prioritization signal, then review the underlying issues before assigning remediation work.
Issue Sources
The Issue Sources chart shows where detected issues came from.
Common issue source groups include:
Use this chart to understand whether the scan risk is mostly coming from vulnerabilities, missing or weak headers, open ports, or other sources.
Top Issues
The Top Issues table shows a snapshot of detected issues for the completed scan.
Use this table to quickly review important issues, filter or search issue titles, check severity, review affected assets, and open supporting references when available.
Open All Findings
Use See all to open the All Findings page for the full technical evidence view.
All Findings provides deeper sections such as:
Reviewing the Dashboard
Use the Scan Results dashboard to quickly understand the completed scan before opening deeper findings.
Common Page Actions
Troubleshooting
Scan result does not open
- 1
Confirm the scan completed successfully.
- 2
Confirm that the result record still exists.
- 3
Return to Completed Scans and open View Results again.
Scan result looks empty
- 1
Confirm the target was entered correctly.
- 2
Check whether the target exposes limited public data.
- 3
Confirm whether the scan returned no detectable issues.
- 4
Run a new scan if the result appears incomplete or stale.
See all does not show expected evidence
- 1
Confirm the scan completed successfully.
- 2
Open See all again from the Top Issues area.
- 3
Check whether the selected target has evidence for that category.
- 4
Run a new scan if the result appears outdated.
Portfolio level seems inaccurate
- 1
Review the Security Issues and Issue Sources sections.
- 2
Open All Findings to review the technical evidence behind the score.
- 3
Interpret the portfolio level with business context.
Best Practices
Confirm target first
Verify the target before reviewing scan results.
Start with summary cards
Review Subdomains Discovered, Open Ports, and TLS/SSL Detected first.
Use portfolio level carefully
Treat the Portfolio Level score as a prioritization signal, not the full investigation.
Review issue sources
Use Issue Sources to understand what is driving the scan result.
Open All Findings for evidence
Use See all when you need DNS, technologies, open ports, TLS, WAF, headers, or other technical evidence.
Use reports for sharing
Use Reports when stakeholders need C-Level or Detailed PDFs.