
SNMP Monitoring
The SNMP Monitoring page provides centralized monitoring for network devices, interfaces, alarms, polling health, and traffic. It helps operators and security teams understand SNMP collection status, device availability, interface behavior, and network health inside a selected time range.
Where to Find It
Open the main navigation menu and go to:
Navigation path
Application route
/snmp-monitoringWhat This Page Is Used For
Device health
Review network device health across the environment.
Interface monitoring
Monitor interface status and traffic.
SNMP alarms
Investigate SNMP alarms and alerts.
Polling performance
Check polling performance and collector health.
Search and filter
Search devices and filter by status, vendor, interface state, severity, or poller.
Interface details
Open interface details for deeper inspection.
Identify issues
Identify slow, down, warning, disabled, or unknown devices and interfaces.
Validate data
Confirm that SNMP data is being collected for the selected time range.
Confirm onboarding
Verify that newly configured SNMP devices are sending data into Logstail.
Main Sections
The SNMP Monitoring page includes:
Header
Header with time range controls and refresh action.
Metadata strip
Shows selected range, generated time, and refresh state.
Tabs
Overview, Devices, Interfaces, Alarms, and Polling.
How to Use This Page
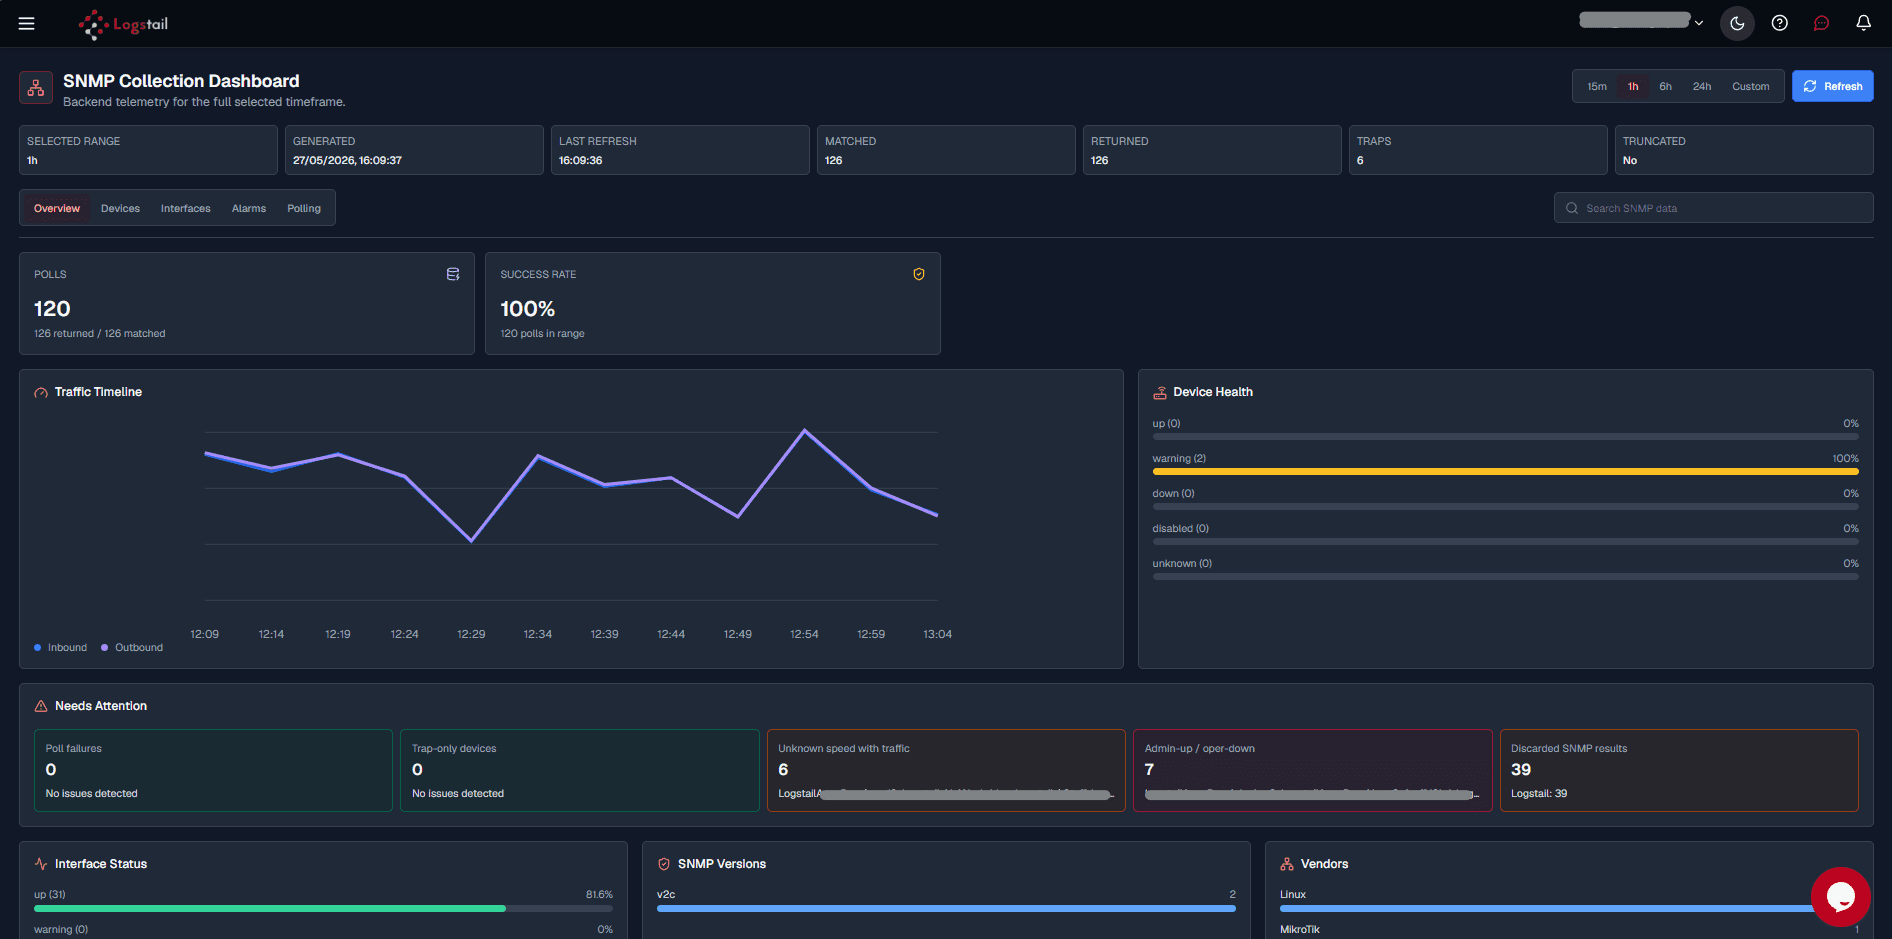
Start from the Overview tab to understand overall SNMP health.
Confirm SNMP Data Is Available
Users can confirm whether SNMP appears to be configured by checking whether SNMP devices, interfaces, alarms, or polling records are visible in the SNMP Monitoring page.
Use these areas to validate SNMP visibility:
Overview
Confirms whether SNMP data exists at a high level.
Devices
Shows monitored SNMP devices.
Interfaces
Shows interfaces discovered through SNMP polling.
Alarms
Shows SNMP alarm activity.
Polling
Shows SNMP collection performance and collector health.
The Polling tab is the most useful place to check whether SNMP collection is working. It can show poll count, success rate, device collection quality, slowest targets, trap-only devices, collector status, active pollers, and queue depth.
If your environment uses runner or capability settings, also confirm that Asset Discovery (SNMP) is enabled for the relevant runner. SNMP monitoring depends on the platform being configured to collect SNMP data from the target devices.
Adding SNMP Data to Logstail
SNMP Monitoring shows data only after SNMP collection is configured and the collector successfully receives polling or trap data from monitored devices.
Before SNMP devices appear in Logstail, the monitored devices must have SNMP enabled, the Logstail metric collector must be installed, SNMP traffic must be allowed, and polling targets or trap listeners must be configured.
Data appears after collection
SNMP devices, interfaces, alarms, and polling records appear only after the collector successfully polls configured targets or receives accepted traps. If the page is empty, check collector setup, device reachability, credentials, firewall rules, polling status, and the selected time range.
SNMP Collection Requirements
The SNMP collector must be able to communicate with monitored devices using the required SNMP ports.
SNMP network requirements
Use these requirements to prepare the network path between monitored devices and the SNMP collector.
| Requirement | Details |
|---|---|
| SNMP polling | Devices must allow polling from the collector on UDP 161. |
| SNMP traps | Devices must send traps to the collector on UDP 162 when trap collection is used. |
| Collector host | The collector should run on a stable, reachable host with minimal downtime. |
| Device reachability | The collector must be able to reach the target device address using the configured SNMP version and credentials. |
| Runner capability | If runner capability settings are used, confirm that Asset Discovery (SNMP) is enabled for the relevant runner. |
SNMP Credential Handling
SNMP credentials should be handled carefully because they allow access to network device monitoring data.
Do not store plain text SNMP secrets
SNMP community strings, authentication passwords, and privacy passwords should not be written directly into SNMP configuration files. Use environment variable references or protected credential files instead.
SNMP credential methods
Use protected references for SNMP secrets instead of writing secret values directly in configuration files.
| Method | Description |
|---|---|
| Environment variable | Use env:NAME references when the collector process loads secrets from the environment. |
| Credential file | Use file:/path/to/secret references when secrets are stored in protected files readable only by the collector service account. |
| Plain text | Do not use plain text SNMP secrets directly in the SNMP YAML configuration. |
Credential file hygiene
Credential files should contain only the secret value, with no quotes, YAML formatting, comments, or extra text.
Time Range Controls
Use the time range controls to decide which SNMP data should be displayed.
Time range controls are useful when:
Use preset ranges for quick review and custom ranges for targeted investigation.
If no data appears, expand the time range to confirm whether SNMP data exists outside the current selected range.
Refresh
The refresh action reloads SNMP monitoring data.
This will update data after you:
Overview Tab
The Overview tab provides a high-level summary of SNMP monitoring.
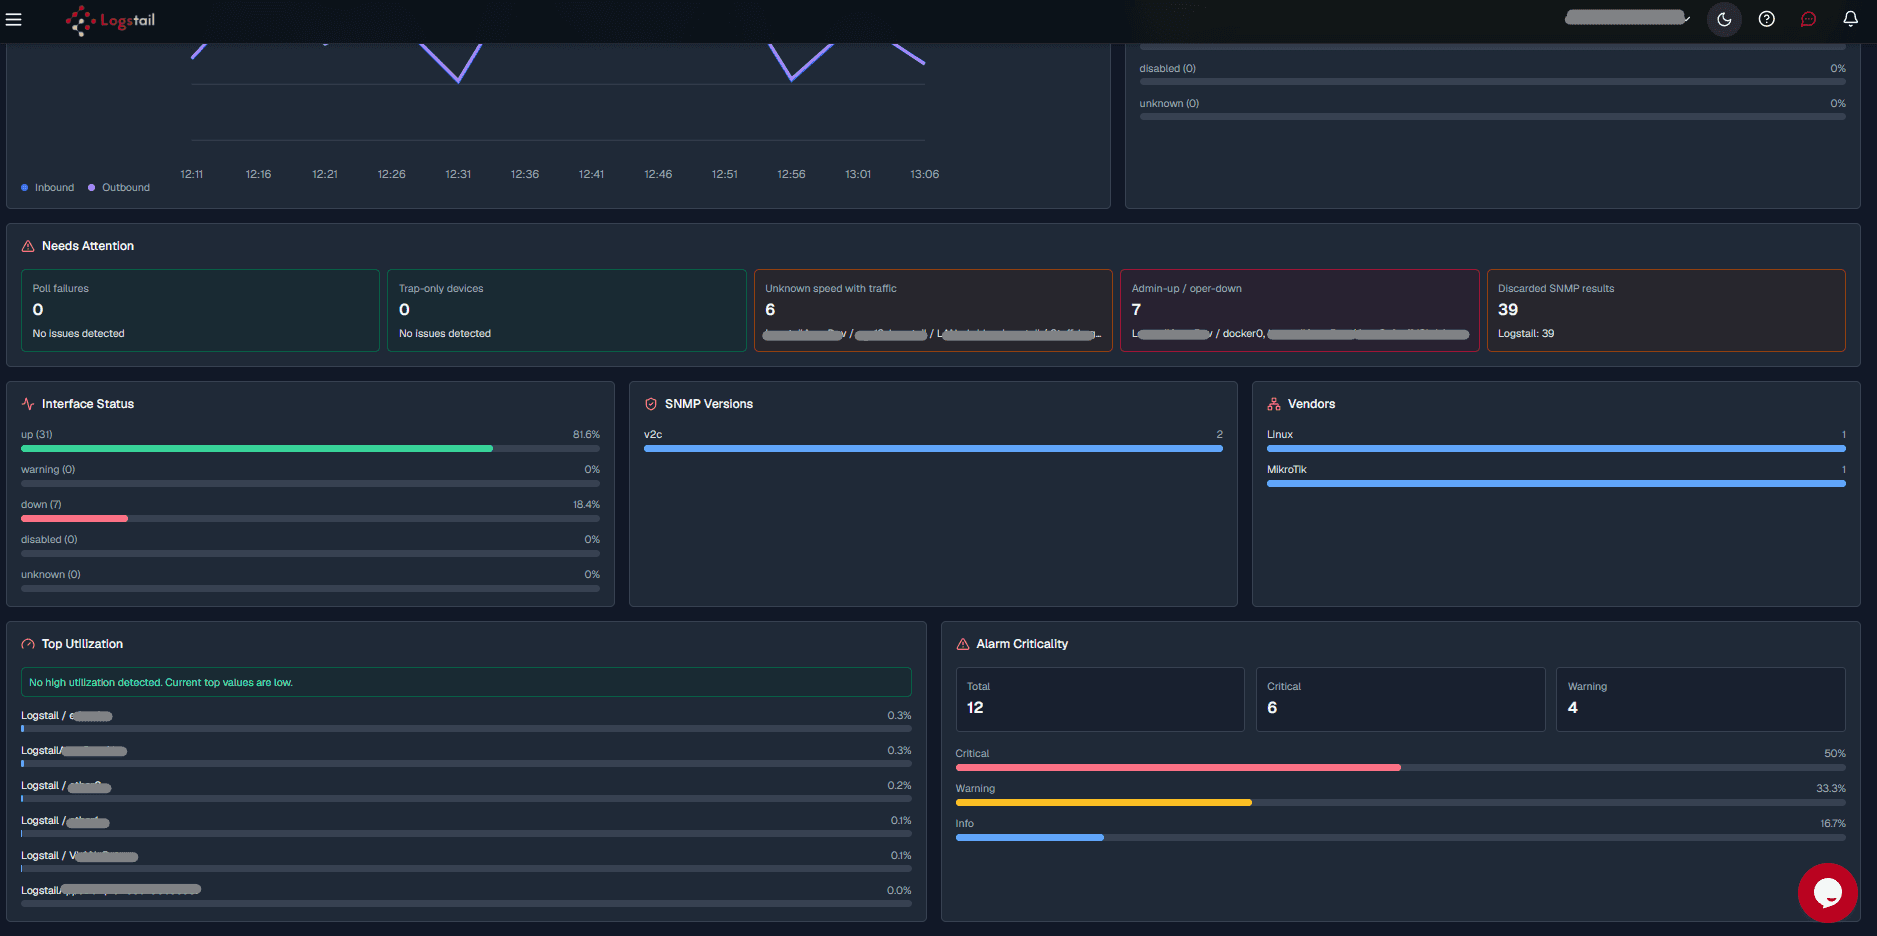
Use it to quickly answer:
Are devices healthy?
Check overall device health.
Are interfaces up or down?
Check interface states.
Are critical alarms active?
Identify active alerts.
Is polling succeeding?
Confirm SNMP collection success.
Are there traffic or collection issues?
Detect abnormal traffic or issues.
The Overview tab is usually the best starting point before drilling into devices, interfaces, alarms, or polling details.
Devices Tab
The Devices tab focuses on monitored SNMP devices.
Use it to:
Common device statuses include:
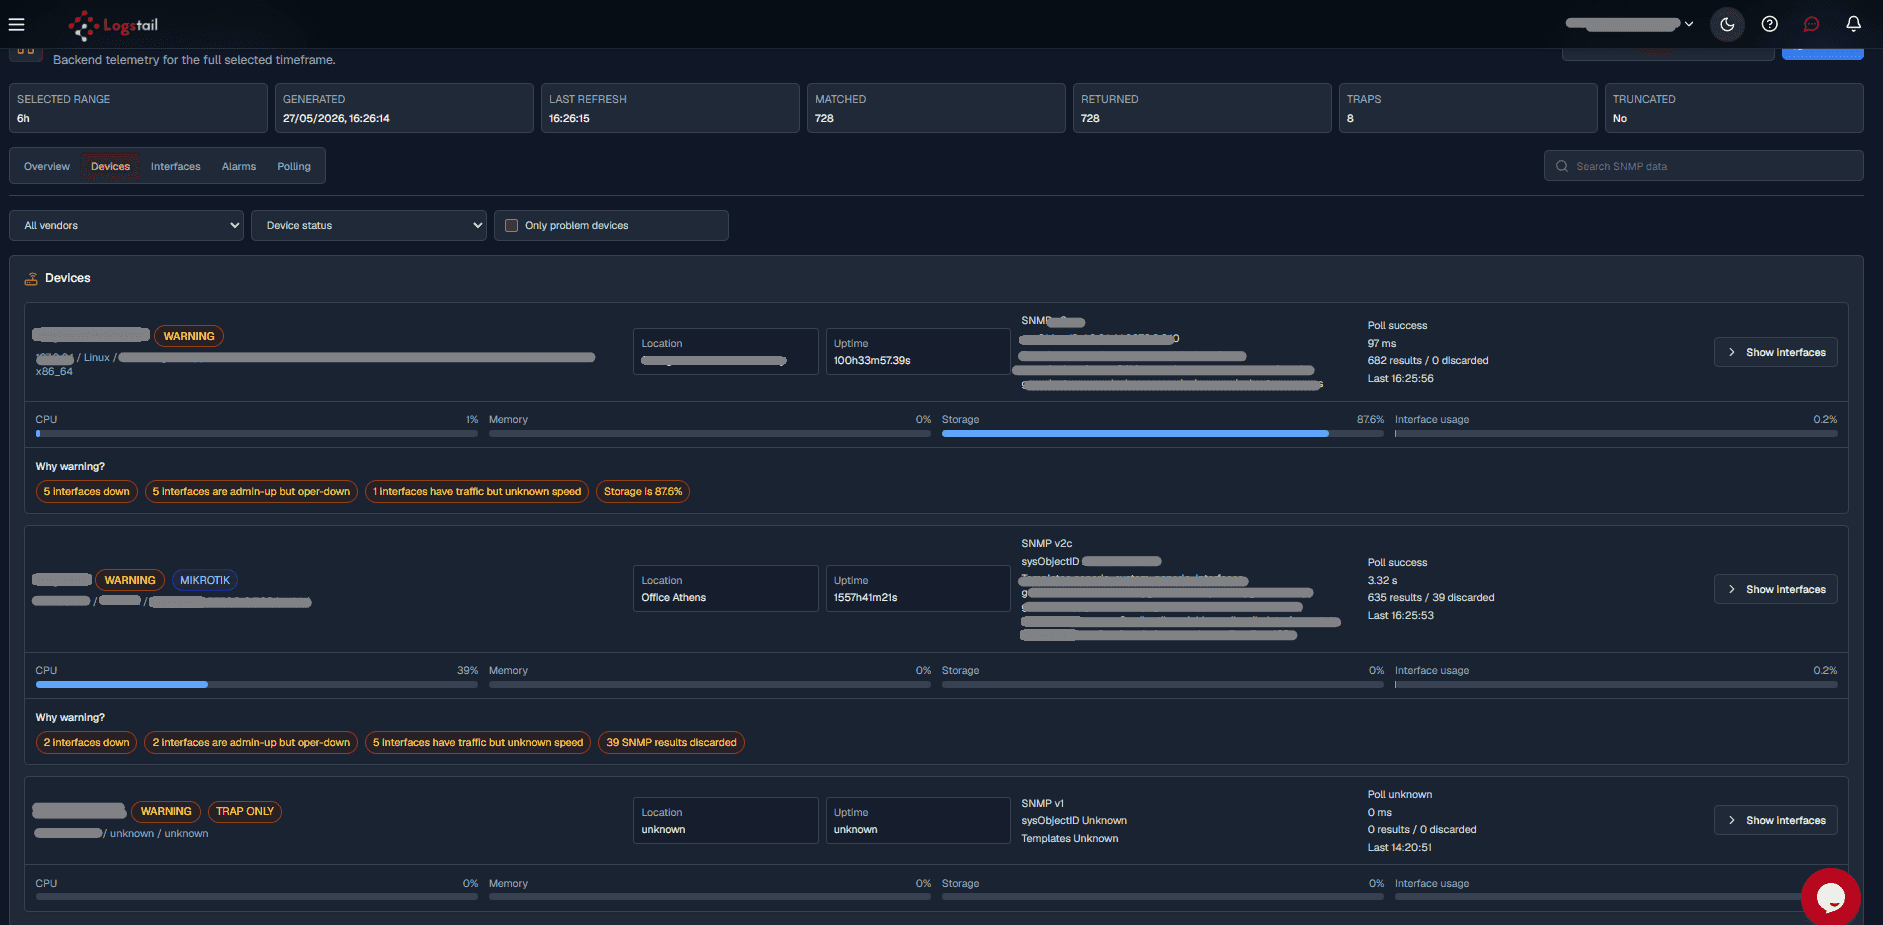
If the Devices tab is empty, confirm the selected time range, SNMP configuration, and polling health.
Show Interfaces from a Device
In the Devices tab, use Show Interfaces to open the interface-level details for a specific SNMP device.
This action connects device health to interface health. Use it when a device shows Warning, Down, high storage usage, interface problems, discarded SNMP results, or traffic-related warnings.

After selecting Show Interfaces, the page expands the selected device into an interface troubleshooting view.
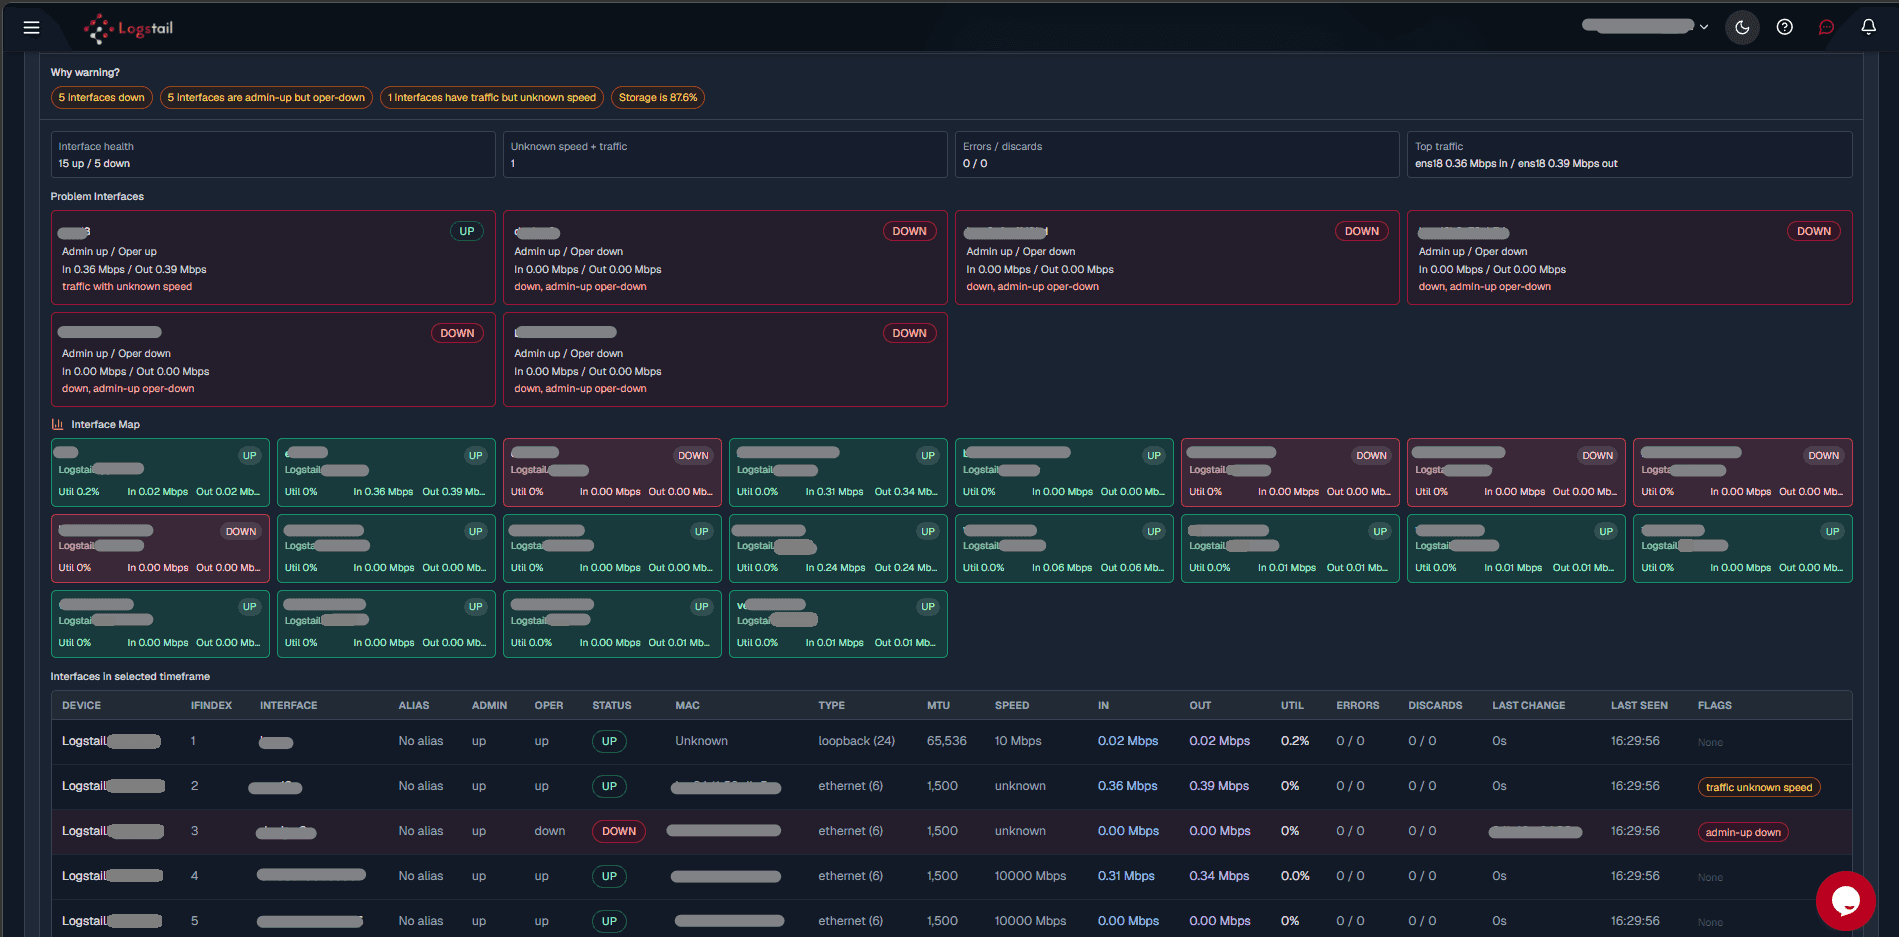
The expanded interface view can show:
Why warning?
Badges explain why the device is in a warning or problem state.
Interface health summary
Shows how many interfaces are up or down.
Unknown metrics
Highlights unknown speed and traffic indicators.
Errors and discards
Displays interface-level error and discard counts.
Top traffic
Shows interfaces with the highest traffic usage.
Problem interfaces
Highlights interfaces currently in warning or error states.
Interface map
Visual map showing up and down interface status.
Time-based view
Displays interfaces relevant to the selected timeframe.
Use this view to answer:
A typical workflow is:
Interfaces Tab
The Interfaces tab focuses on network interfaces discovered through SNMP.
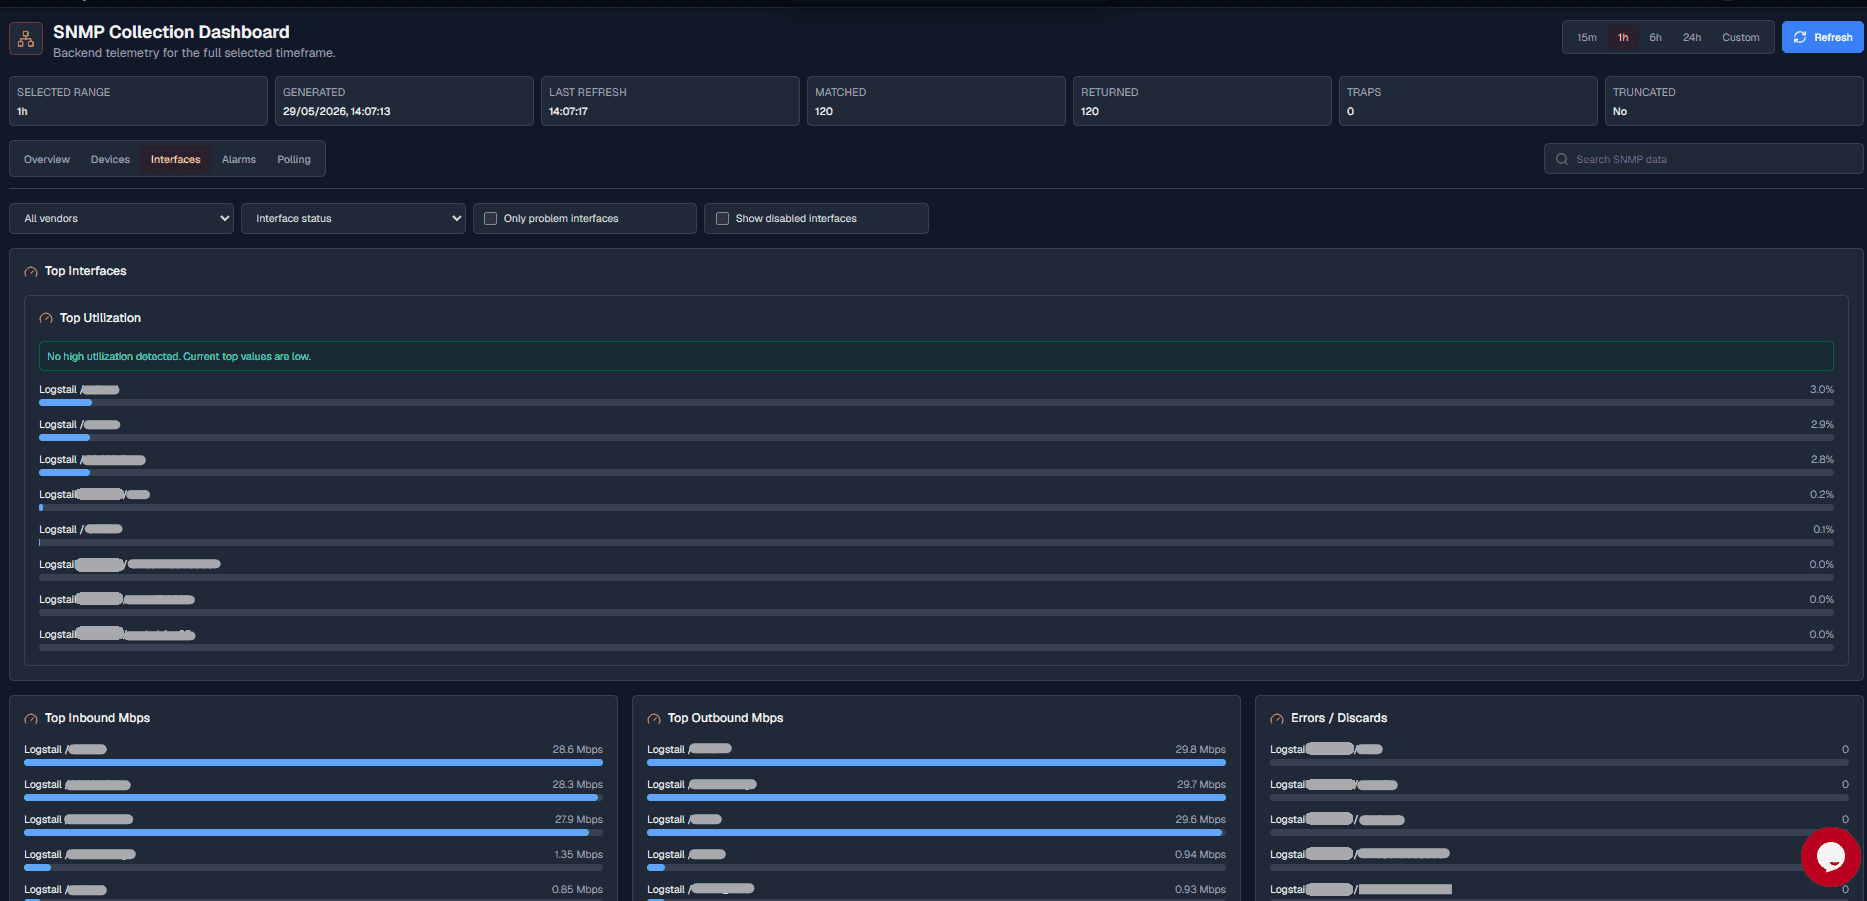

Use it to:
Alarms Tab
The Alarms tab focuses on SNMP alarms and event activity.
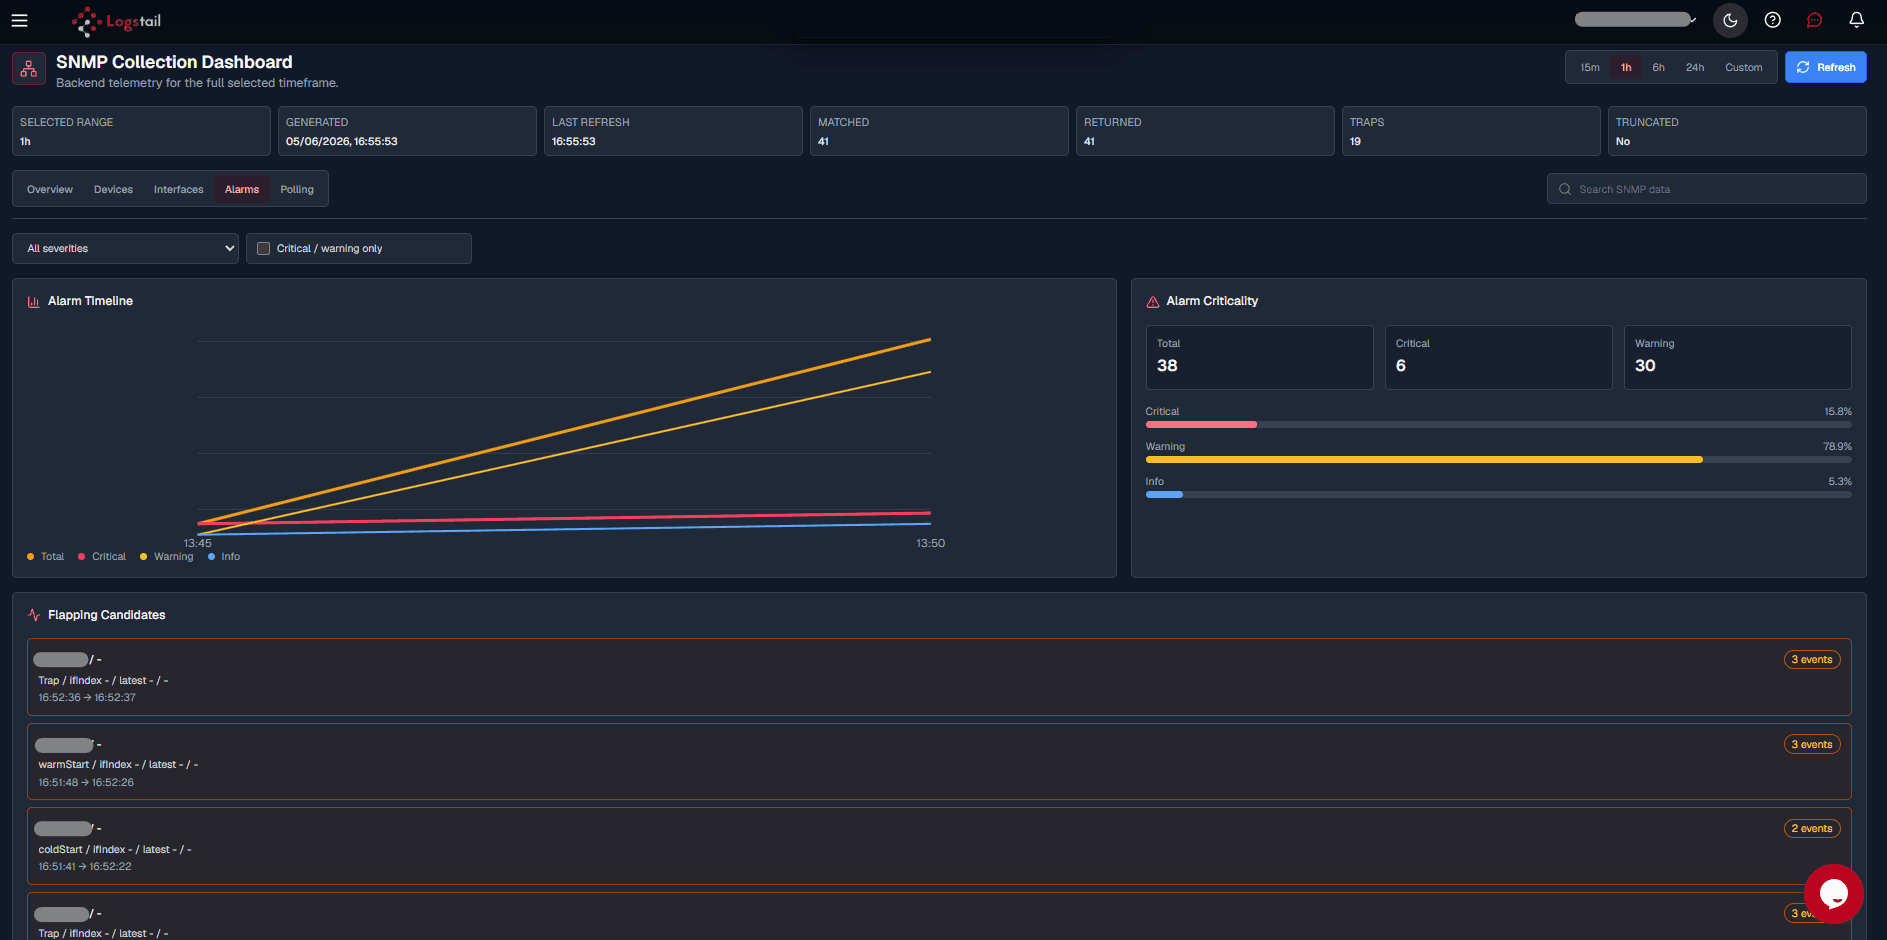
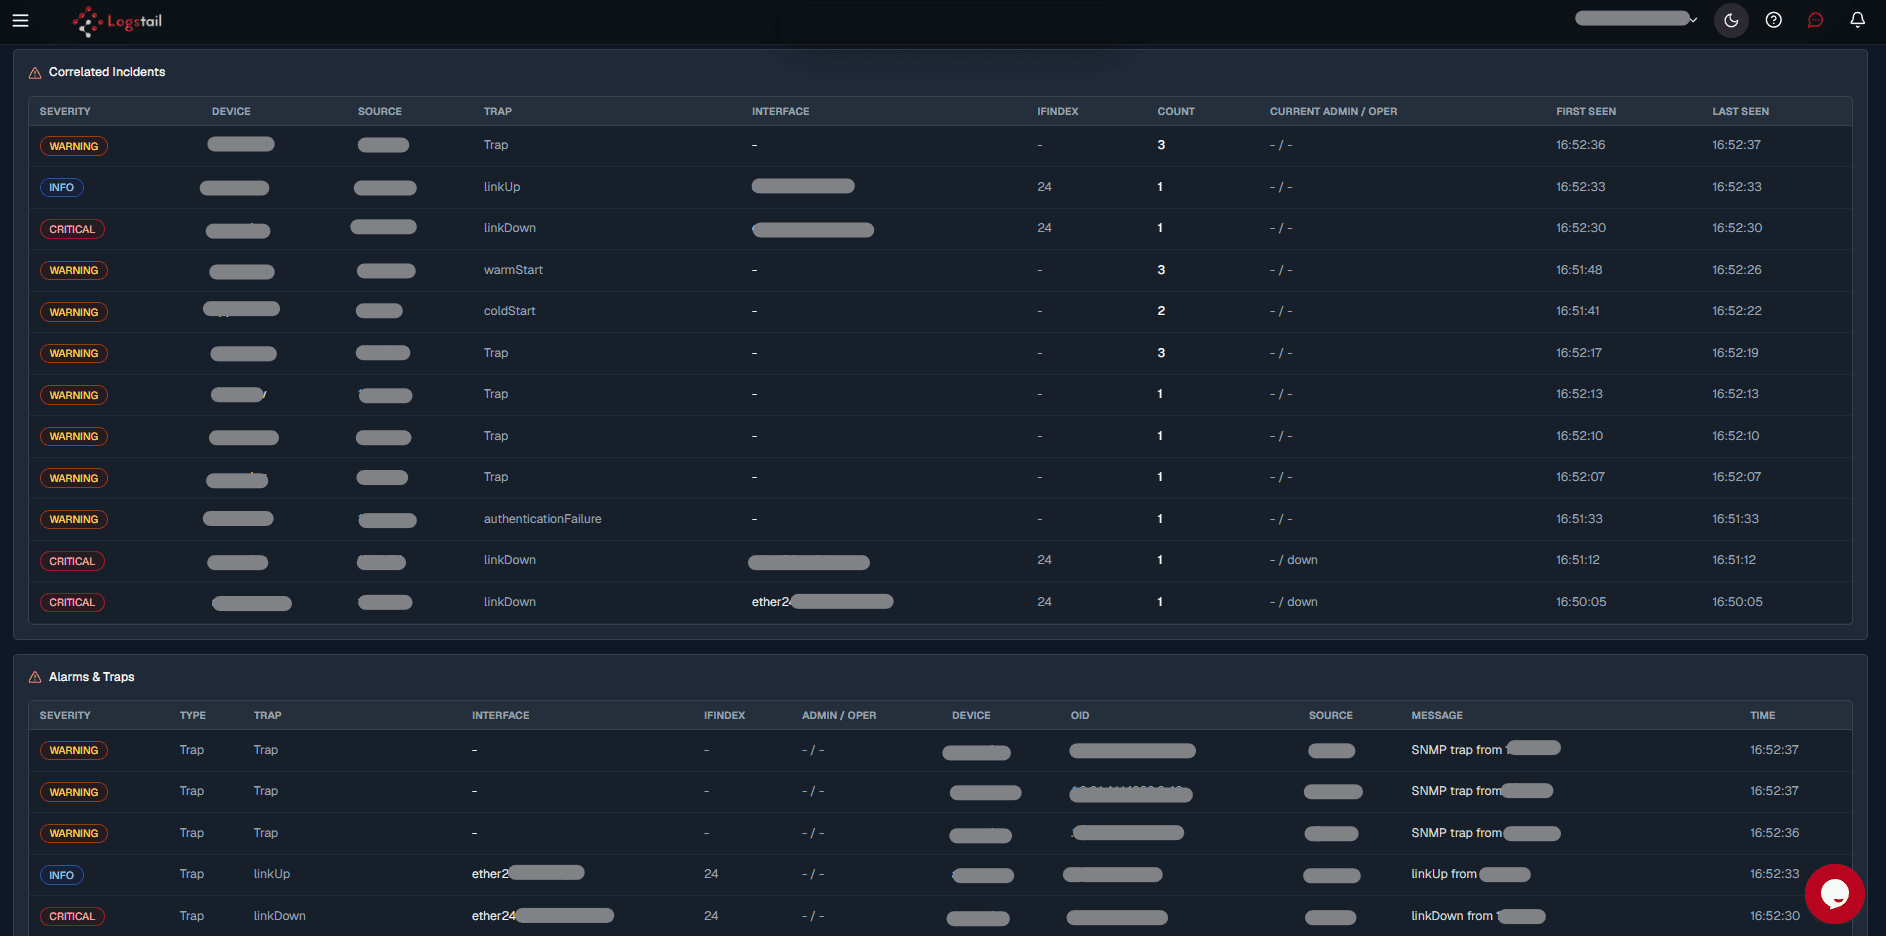

Use it to:
Common alarm severities include:
Polling Tab
The Polling tab focuses on SNMP collection performance and collector health.
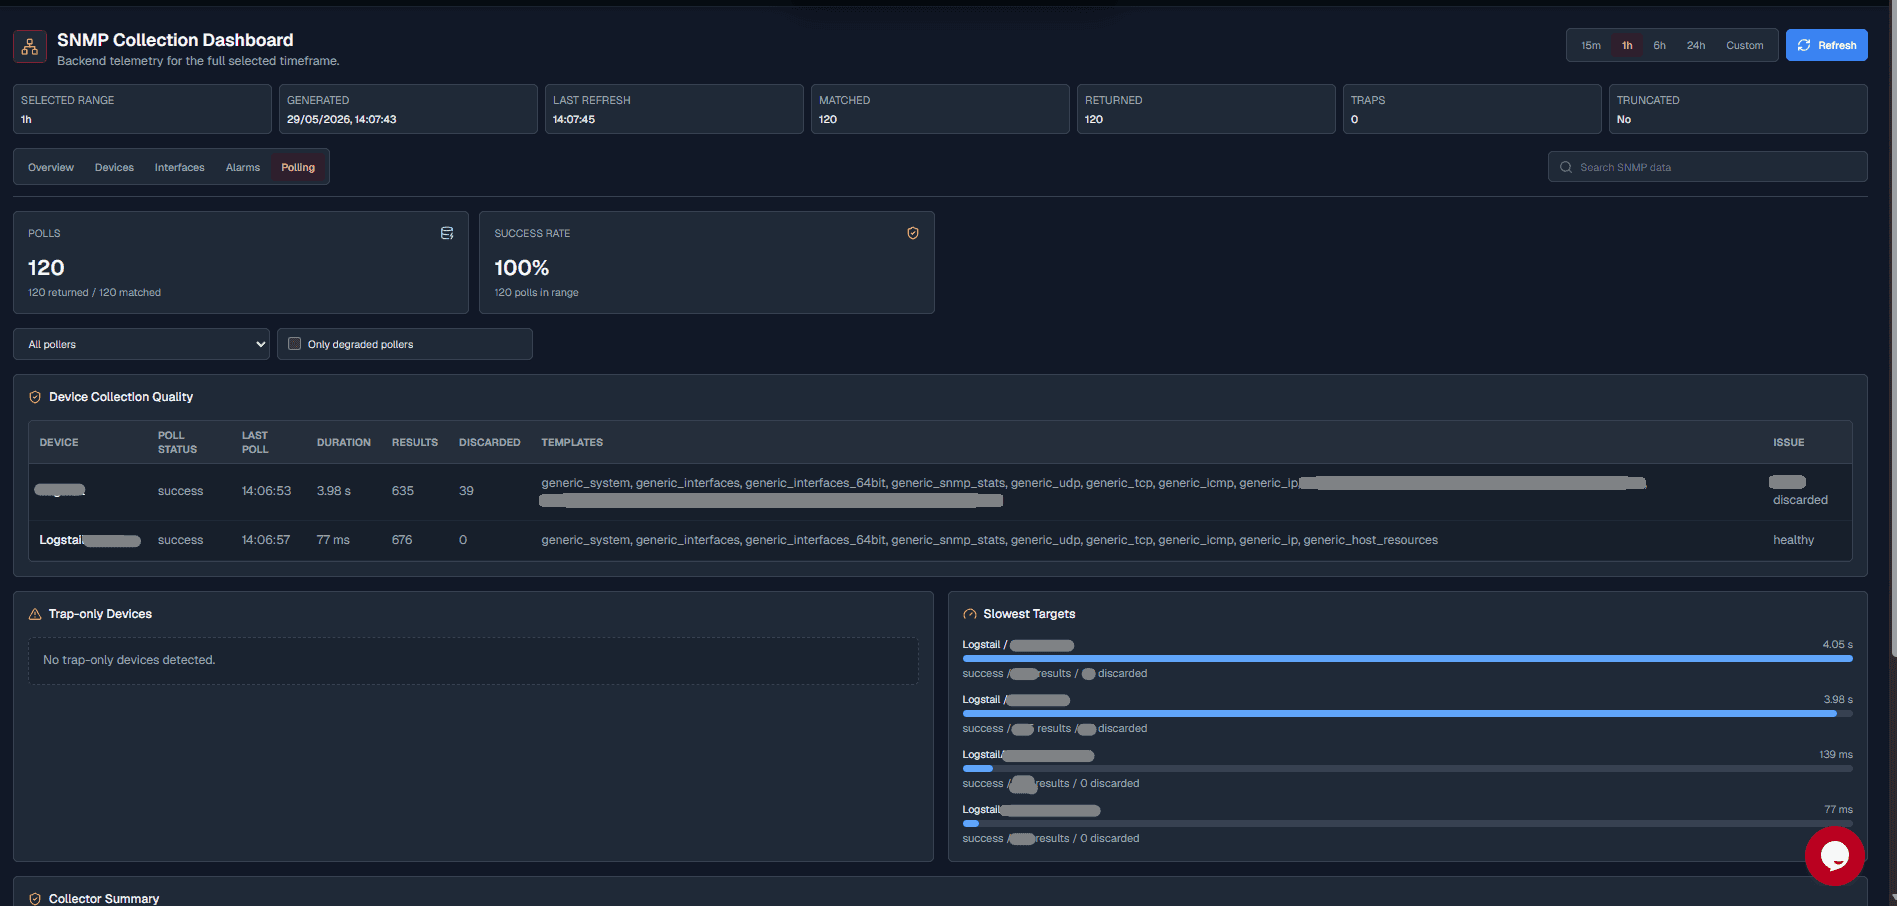

Use it to review:
The Polling tab helps confirm whether SNMP collection is functioning correctly.
Use this tab when:
Search and Filters
SNMP Monitoring supports global search and targeted filters.
Common filters include:
Use filters to reduce noise and focus on devices, interfaces, alarms, or pollers that need action.
Empty State
If no SNMP data exists for the selected range, the page shows an empty state.
An empty state does not always mean SNMP is not configured. It may mean there is no SNMP data for the selected time range, the collector has not polled successfully yet, or the selected filters hide available results.
No SNMP data found
If there are no devices, interfaces, alarms, or polling records after these checks, SNMP monitoring may not be configured for the selected environment, the collector may not be receiving data, or the selected account or tenant may not have SNMP data available.
Common Workflows
Troubleshooting
No SNMP data appears
- 1
Check the selected time range and expand it if needed.
- 2
Clear search terms and filters that may hide available SNMP data.
- 3
Confirm SNMP collector configuration, device reachability, credentials, firewall rules, and polling status.
- 4
Check whether Asset Discovery (SNMP) is enabled where collector capability settings are used.
SNMP configuration is unclear
- 1
Open the Polling tab first.
- 2
Check for polling activity, active pollers, collector status, and queue depth.
- 3
Check whether any devices appear in the Devices tab.
- 4
If there is no polling activity and no devices, SNMP may not be configured for the selected environment.
- 5
Confirm SNMP configuration with the platform administrator or check collector/capability settings if available.
A device is unknown
- 1
Check whether the platform has enough recent SNMP data to determine the device state.
- 2
Review polling status and device response.
- 3
Expand the selected time range.
- 4
Confirm whether the device has recently reported SNMP data.
Interfaces are missing
- 1
Confirm the device exposes interface data through SNMP.
- 2
Confirm the collector has successfully polled the device.
- 3
Check whether disabled interfaces are hidden by the current filter.
Collector is configured but no devices appear
- 1
Confirm SNMP is enabled on the target devices.
- 2
Confirm the collector can reach devices on UDP 161.
- 3
Check that the SNMP module is enabled.
- 4
Confirm each target has enabled set to true.
- 5
Validate SNMP credentials and templates.
- 6
Run collector validation and review errors.
- 7
Open the Polling tab to check collector status, poll count, success rate, and queue depth.
Traps are not appearing
- 1
Confirm trap listener is enabled.
- 2
Confirm devices send traps to the collector on UDP 162.
- 3
Check firewall rules between devices and the collector.
- 4
Confirm allowed trap sources include the device IP addresses or CIDR ranges.
- 5
Confirm accepted SNMP trap versions match the device configuration.
- 6
Validate trap community or SNMP v3 trap user configuration.
Collector validation fails
- 1
Check for invalid YAML syntax.
- 2
Confirm the stack token is configured.
- 3
Confirm module definition files are present.
- 4
Check that enabled modules have matching module files.
- 5
Fix validation errors and run validation again before starting the collector.
Polling success rate is low
- 1
Check network latency between the collector and devices.
- 2
Confirm SNMP credentials are valid.
- 3
Check device availability.
- 4
Review collector load and queue depth.
Best Practices
Review daily
Review SNMP Monitoring during daily operations.
Start from Overview
Start from Overview, then drill into Devices, Interfaces, Alarms, and Polling.
Check polling health
Use the Polling tab to confirm SNMP collection health.
Use problem filters
Use problem-only filters during incident triage.
Validate before running
Run collector validation after configuration changes and before restarting the collector.
Protect SNMP secrets
Use environment variables or protected files instead of plain text credentials.
Restrict trap sources
Define allowed trap sources instead of accepting traps from any source.
Run as a service
Run the collector as a system service for stable long-term monitoring.
Monitor success rate
Monitor polling success rate and collector health.
Investigate recurring alarms
Investigate recurring alarms instead of treating them as noise.
Keep names consistent
Keep device naming consistent.
Use interface details
Use interface details before escalating network issues.
Validate new coverage
Validate SNMP coverage after onboarding new network devices.
Check empty states carefully
When the page is empty, check time range, filters, polling status, and SNMP configuration before assuming there is no issue.