
Pre-Built Dashboards
The Pre-Built Dashboards page provides access to ready-made dashboard templates for common data sources and monitoring use cases. These dashboards help users quickly visualize collected data without building every visualization from scratch.
Where to Find It
Open the navigation bar and go to:
Navigation path
Application route
/apps2goWhat This Page Is Used For
Use the Pre-Built Dashboards page to quickly install, review, and reuse ready-made dashboards.
Add ready-made dashboards
Install dashboards instantly.
Monitor faster
Start analyzing common log data quickly.
Explore samples
Review example dashboards for inspiration.
Use as templates
Build custom dashboards from pre-built ones.
Visualize collector data
Confirm data flow after installation.
Reduce setup time
Accelerate dashboard creation for common use cases.
Collector data required
Pre-built dashboards only show useful data after the matching Logstail Agent, collector, or data source is installed and sending events to Logstail.
Who should use this page
Administrators
Onboard data sources and make dashboards available for users.
SOC analysts
Monitor dashboards and review security telemetry.
SOC engineers
Validate telemetry quality, dashboard structure, and data coverage.
IT operations teams
Review system, infrastructure, and network data.
Incident responders
Use dashboards as a starting point for investigations.
Compliance and reporting users
Prepare evidence and review dashboard data for reporting workflows.
New users
Learn the dashboard structure and understand where key data appears.
Page Overview
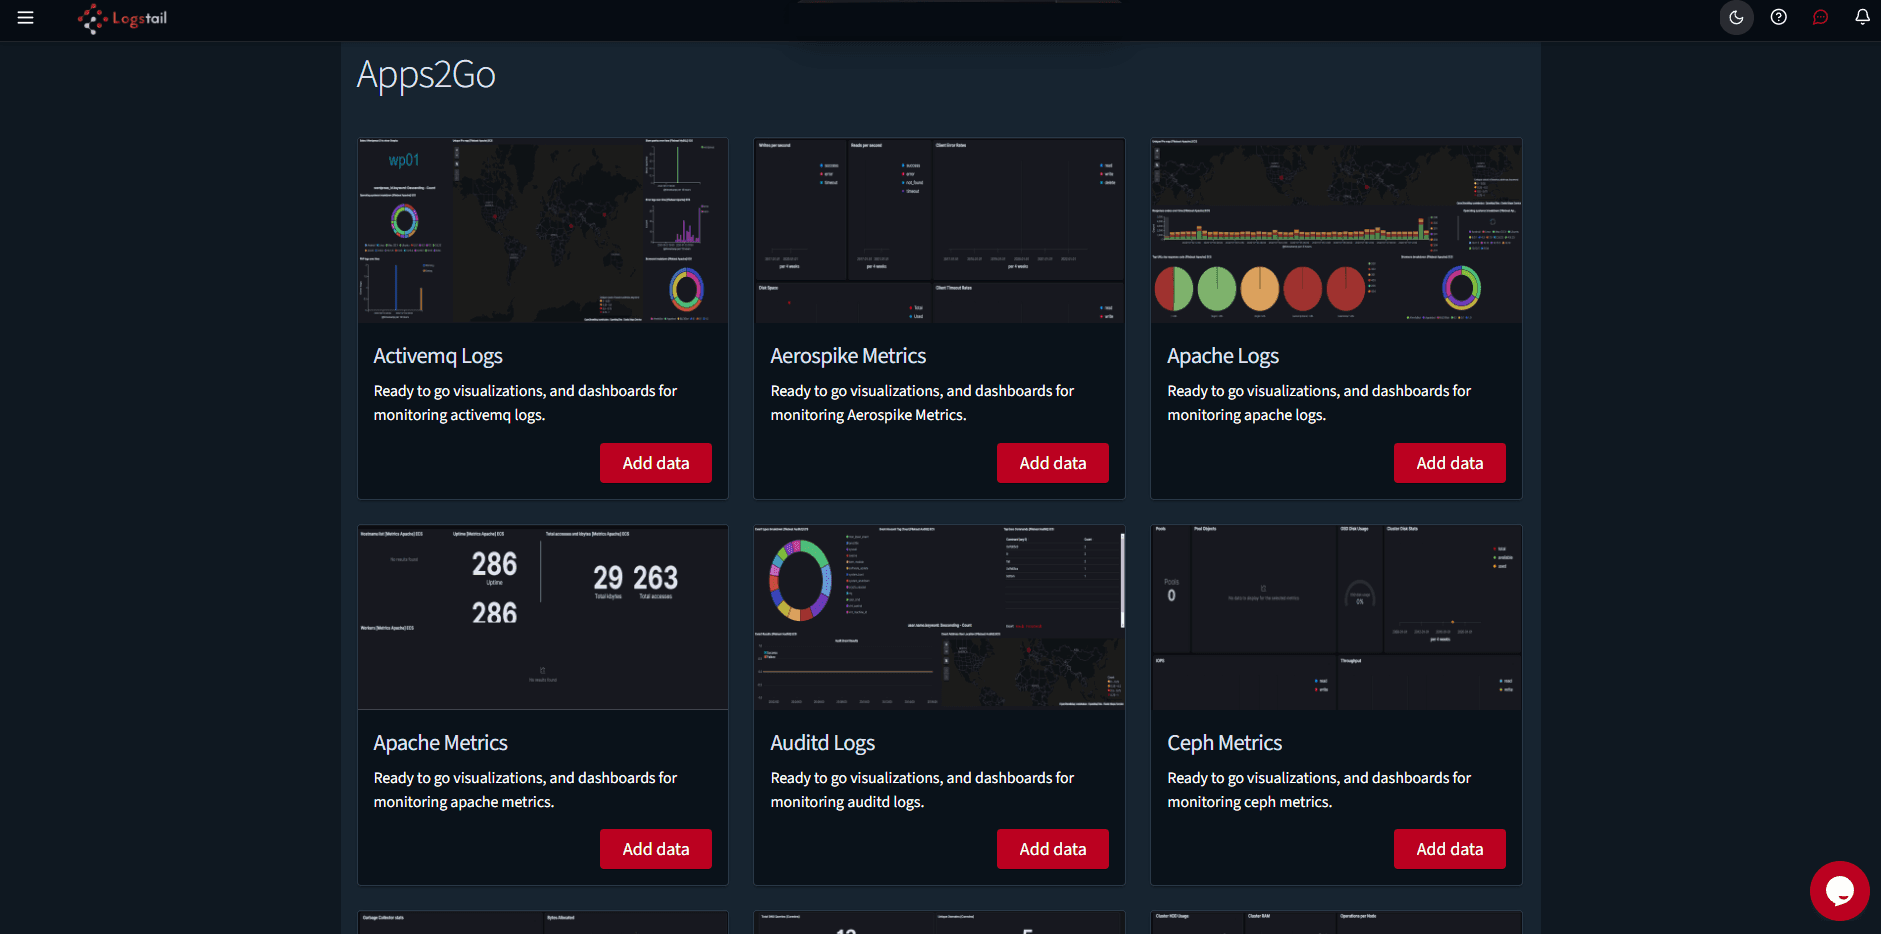
The Pre-Built Dashboards page opens the Apps2Go catalog, where users can browse ready-made dashboard packages for common log sources, metrics, and services.
Each catalog card shows a dashboard preview, the dashboard name, a short description, and an Add data action for installing or connecting the dashboard package.
Dashboard Concept
A dashboard is a collection of visualizations, saved searches, and maps that provide a quick view into data.
Dashboards can help users:
What Users Can Do with Dashboards
Dashboards are configurable. Users can:
Example: Windows Event Logs Dashboard
Windows Event Logs dashboard
After installing and starting the Windows Event Logs collector, users can add the Windows Event Logs Dashboard from the Pre-Built Dashboards page.
The dashboard can be found here:
Open the main navigation menu and go to:
Navigation path
Application route
/dashboardsSearch for:
Windows Events [Overview]
Failed logons
Review failed Windows logon activity and authentication issues.
Successful logons
Review successful Windows logons and endpoint access activity.
Event criticality
Review event severity and criticality across Windows endpoint activity.
Sample Dashboards
Sample dashboards are useful for learning the platform and validating data visualization workflows.
Examples of useful sample dashboard categories may include:
Available dashboard templates depend on the platform library and installed content.
Observing Data After Installation
After a pre-built dashboard is added, open the relevant dashboard from Analytics.
A typical validation workflow is:
Customizing a Pre-Built Dashboard
Pre-built dashboards are starting points. Users can customize them based on operational needs.
Customization examples:
When to Use Pre-Built Dashboards
Use pre-built dashboards when:
Troubleshooting
Dashboard does not show data
- 1
Confirm the matching Logstail Agent, collector, or data source is installed and running.
- 2
Verify that events are being sent to Logstail.
- 3
Check the selected dashboard time range.
- 4
Validate raw events in Discover before assuming the dashboard is broken.
Dashboard is not found in Analytics
- 1
Ensure the dashboard was added from Pre‑Built Dashboards.
- 2
Try to check for the status message of your Dashboard being created
Dashboard panels show errors
- 1
Required saved objects or index patterns may be missing or changed.
Data looks incorrect
- 1
Review dashboard filters and time range.
- 2
Validate raw events in Discover.
Embedded controls differ from this guide
- 1
Pre‑Built Dashboards is an embedded page; controls may vary by backend configuration.
Best Practices
Add dashboards after collectors
Install dashboards only after the matching collector is active.
Validate in Discover
Check raw events when dashboards appear empty.
Duplicate before editing
Copy dashboards before making major changes.
Use clear names
Name dashboards based on purpose and use case.
Remove unused panels
Keep dashboards clean and focused.
Use templates wisely
Treat pre-built dashboards as starting points, not final configs.
Related Pages
Related Pages
Pages commonly used alongside Pre-Built Dashboards
| Page | Description |
|---|---|
| Logstail Agent | Install and configure collectors that send data into Logstail before using related pre-built dashboards. |
| Dashboards | Open and use dashboards after they are added from the Pre-Built Dashboards page. |
| Discover | Validate raw events when a dashboard is empty or data looks incorrect. |