Alerts
The SOAR Alerts page is the central workspace for reviewing, triaging, investigating, and managing security alerts in Logstail. It gives SOC users a single view of alert volume, alert severity, affected agents, MITRE context, alert status, ownership, and response actions.
Where to find it
Open the main navigation menu and go to:
Sidebar path
Route path
/soar/alert-managementWhat this page is used for
Access depends on the user’s assigned role and subscription context. Users without the required SOAR access may see a role or plan restriction page instead of the alert workspace.
Who uses this page
The SOAR Alerts page is designed for security operations workflows, especially for:
Analysts
Perform alert triage and review security detections.
Incident Responders
Investigate active threats and validate suspicious activity.
Senior SOC Analysts
Coordinate response workflows and escalation decisions.
Admins
Manage alert operations, ownership, and escalation settings.
Page Overview
SOAR Alerts operational areas
The SOAR Alerts page is made up of several operational areas that help analysts review alert volume, filter results, investigate records, and perform alert operations.
| Area | Purpose |
|---|---|
| Summary charts | Show alert volume, status, severity, and top alerting agents for the selected timeframe. |
| Timeframe selector | Located in the top-right control area. Controls the date and time window used by charts and alert table results. |
| Search bar | Finds alerts by alert name or related searchable alert text. |
| Saved Filters | Applies previously saved alert filter combinations. |
| Save Filter | Saves the current filter setup for reuse. |
| Add Filter | Adds a new filter condition to the alert view. |
| Alerts table | Displays alert records that match the selected timeframe, search query, and filters. |
| Row actions | Provides per-alert actions such as details, investigation, assignment, case creation, and alert operations. |
| Bulk actions | Applies supported operations to multiple selected alerts. |
| Pagination | Controls how many alerts are shown per page and moves between pages. |
Timeframe Selector
The timeframe selector is located in the top-right control area of the SOAR Alerts view.
It appears next to the notification threshold selector and the Refresh button. The selector displays the active date and time range, for example:
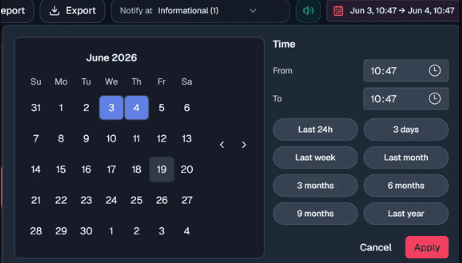
Jun 3, 10:47 → Jun 4, 10:47
Clicking the timeframe selector opens the date and time picker.
From this picker, users can:
The selected timeframe controls which alerts are included in the page view. It affects both the summary charts and the alert table.
Use timeframe selection to:
When a custom start and end date are selected, the charts and table update to show alerts from that period.
Charts and Alert Metrics
Status Distribution
Shows alert distribution by lifecycle state such as Open, Under Investigation, or Closed. Use it to understand how much alert volume still needs triage.
Alerts Over Time
Displays alert volume across the selected timeframe. Use it to identify spikes, recurring bursts, or quiet periods.
Top Agents
Highlights agents generating the most alerts. Use it to identify noisy endpoints, compromised hosts, unstable systems, or agents needing deeper investigation.
Severity Distribution
Shows alert distribution by severity. Use it to prioritize critical and high‑severity alerts before lower‑severity queues.
Notification Threshold
Alerts users when new alerts of a selected severity appear during live refresh. Use it during active SOC monitoring so high‑severity alerts are not missed.
Search & Filter Alerts
Alert Search Filters help users reduce alert noise and focus on the alerts that matter.
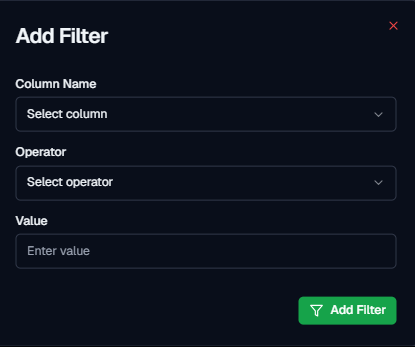
Users can filter alerts by available alert fields such as:
Common filters for everyday workflows include:
Tips for filtering
| Goal | Example filter strategy | |
|---|---|---|
| Prioritize urgent work | Filter for High or Critical severity. | |
| Continue active investigations | Filter for Under Investigation status. | |
| Review untriaged alerts | Filter for Open status and unassigned alerts. | |
| Validate confirmed threats | Filter for Verified alerts. | |
| Reduce noise | Filter or review alerts flagged as False Positive. | |
| Focus by owner | Filter by a specific assignee. | |
| Focus by endpoint | Filter by agent name or related context. | |
| Focus by detection | Filter by alert name or detection family. | |
| Focus by MITRE context | Filter by MITRE tactic or technique. |
After applying filters, users can clear them to return to the full alert view for the selected timeframe.
Visible Filter Options
By clicking on the Filter button above the alert table you are provided the following filter options:

Saved Filters
Apply a previously saved filter combination. Useful for repeatable SOC workflows such as critical open alerts, high‑severity unassigned alerts, investigation queues, false‑positive review, analyst‑assigned alerts, or noisy detection families.
Save Filter
Save the current filter setup for later reuse. Configure timeframe, search terms, and filter conditions beforehand so the saved view matches the workflow you want to repeat.
Add Filter
Create a new filter condition. Use this to narrow alerts by severity, status, flag, assignee, agent, alert name, or MITRE context.
Alerts Table
The alerts table is the main triage area. It displays alerts that match the selected timeframe, search query, and filters.
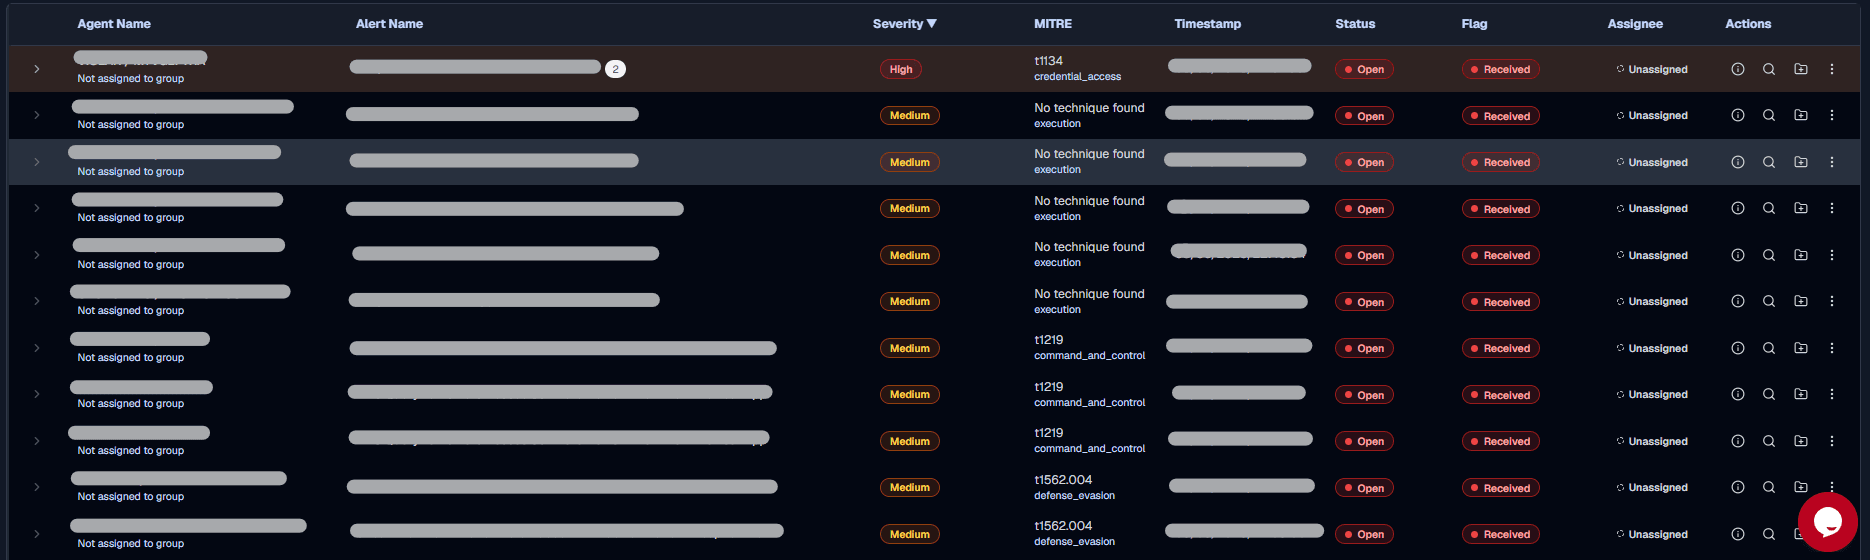
The table includes these core columns:
Alert Table Columns
| Column | Description | |
|---|---|---|
| Agent Name | Endpoint or agent associated with the alert. | |
| Alert Name | Detection or rule that generated the alert. | |
| Severity | Informational, low, medium, high, or critical. | |
| MITRE | Mapped MITRE ATT&CK context when available. | |
| Timestamp | When the alert was generated. | |
| Status | Lifecycle state of the alert. | |
| Flag | Validation flag such as verified or false positive. | |
| Assignee | User responsible for the alert. | |
| Actions | Available response actions. |
Sort Alert Data
Use column sorting to reorder table results and move high-value records to the top. You can do this by clicking on one of the table columns, which will create a sort by arrow.
Sorting is useful for:
Open Alert Details
Use Show Details to open the alert detail view.
Alert details should be reviewed before high-impact actions such as closing an alert, marking it as verified, declaring it a false positive, or creating a case.
Investigate an Alert
Use the Investigate action when an alert needs deeper analysis.
Investigation helps the user pivot from the alert into supporting telemetry. This is where an analyst can validate whether the alert is real, look for related events, and determine the scope of activity around the affected agent or timeframe.
Use investigation when:
Create a Case from an Alert
Use Create Case when an alert requires incident response tracking.
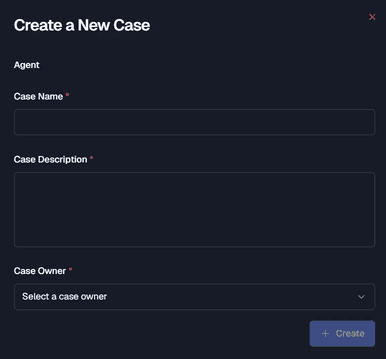
Creating a case is appropriate when:
A case allows the team to coordinate investigation work and link related alerts, assets, playbooks, IOCs, and notes.
Add an Alert to an Existing Case
Use Add to existing case when the alert belongs to an incident that is already being tracked.
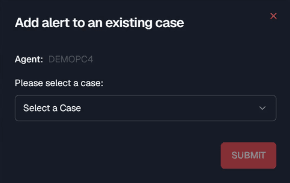
This keeps related evidence grouped together and avoids creating duplicate cases for the same incident.
Use this when:
Set Alert Status
Alert status communicates where the alert is in the triage lifecycle.
Alert Status
| Status | Meaning | |
|---|---|---|
| Open | Newly received or not yet reviewed. | |
| Under Investigation | Actively being analyzed. | |
| Closed | Resolved, mitigated, or no further action required. |
A recommended workflow:
Set Alert Flag
Alert flags communicate analyst validation.
Alert Flags
| Flag | Meaning | |
|---|---|---|
| Verified | A confirmed security threat or meaningful detection. | |
| False Positive | Triggered incorrectly or not a real issue. |
Use Verified when the alert reflects real suspicious or malicious activity.
Use False Positive when the alert is benign, expected, test-generated, misconfigured, or otherwise not security-relevant.
Assign Alerts
Use the Assignee field to assign ownership to a user in the stack.
Assignments improve accountability and reduce duplicated work. By default, alerts may appear unassigned. Selecting the assignee field opens a user selection popup where an alert can be assigned to an available user account.
Use assignments to:
Assignments can also be applied through bulk actions.
Use Bulk Actions
Bulk actions let users operate on multiple selected alerts at once.

Use bulk actions for fast triage when several alerts share the same conclusion or owner.
Common bulk action examples:
Documentation tip
Be careful with bulk actions. Before closing, deleting, or marking alerts as false positive, validate that the selected alerts are truly related and should receive the same treatment.
Delete Alerts
Manage False Positives
False-positive management is used to reduce repeated handling of known benign alerts.
When a user selects the false-positive action, Logstail displays a checklist of field-value pairs extracted from the log that caused the alert. These field-value pairs describe the alert context that contributed to the detection.
There are two main false-positive options:
False-Positive Options
| Option | Effect | |
|---|---|---|
| Flag This Alert | Flags only the selected alert as a false positive. Does not affect past or future alerts. | |
| Flag All Related Alerts | Creates a ruleset from selected field-value pairs. Future matching alerts can be auto-closed and flagged. |
Use Flag This Alert when the alert is a one-off benign event.
Use Flag All Related Alerts when the same benign pattern is repeatedly generating noise and should be suppressed or handled automatically.
False-Positive Rulesets
False-positive rulesets help suppress repeated benign alert patterns.
A ruleset can automatically handle alerts when:
When matched, related alerts can be automatically closed and flagged as false positive without an assignee. This improves signal-to-noise ratio and keeps analysts focused on meaningful alerts.
Use precise field-value pairs. Broad rules can suppress alerts that should still be investigated.
Review Frequent and Infrequent Alerts
The frequency controls help users identify alert patterns.
Frequent alerts can indicate:
Infrequent alerts can also be valuable. Rare detections may represent manual attacker behavior, unusual administrator activity, or abnormal endpoint events.
Use frequency review during shift handover, detection tuning, and incident discovery.
Generate an Alert Report
Use Generate Report to create a report from the current page state.
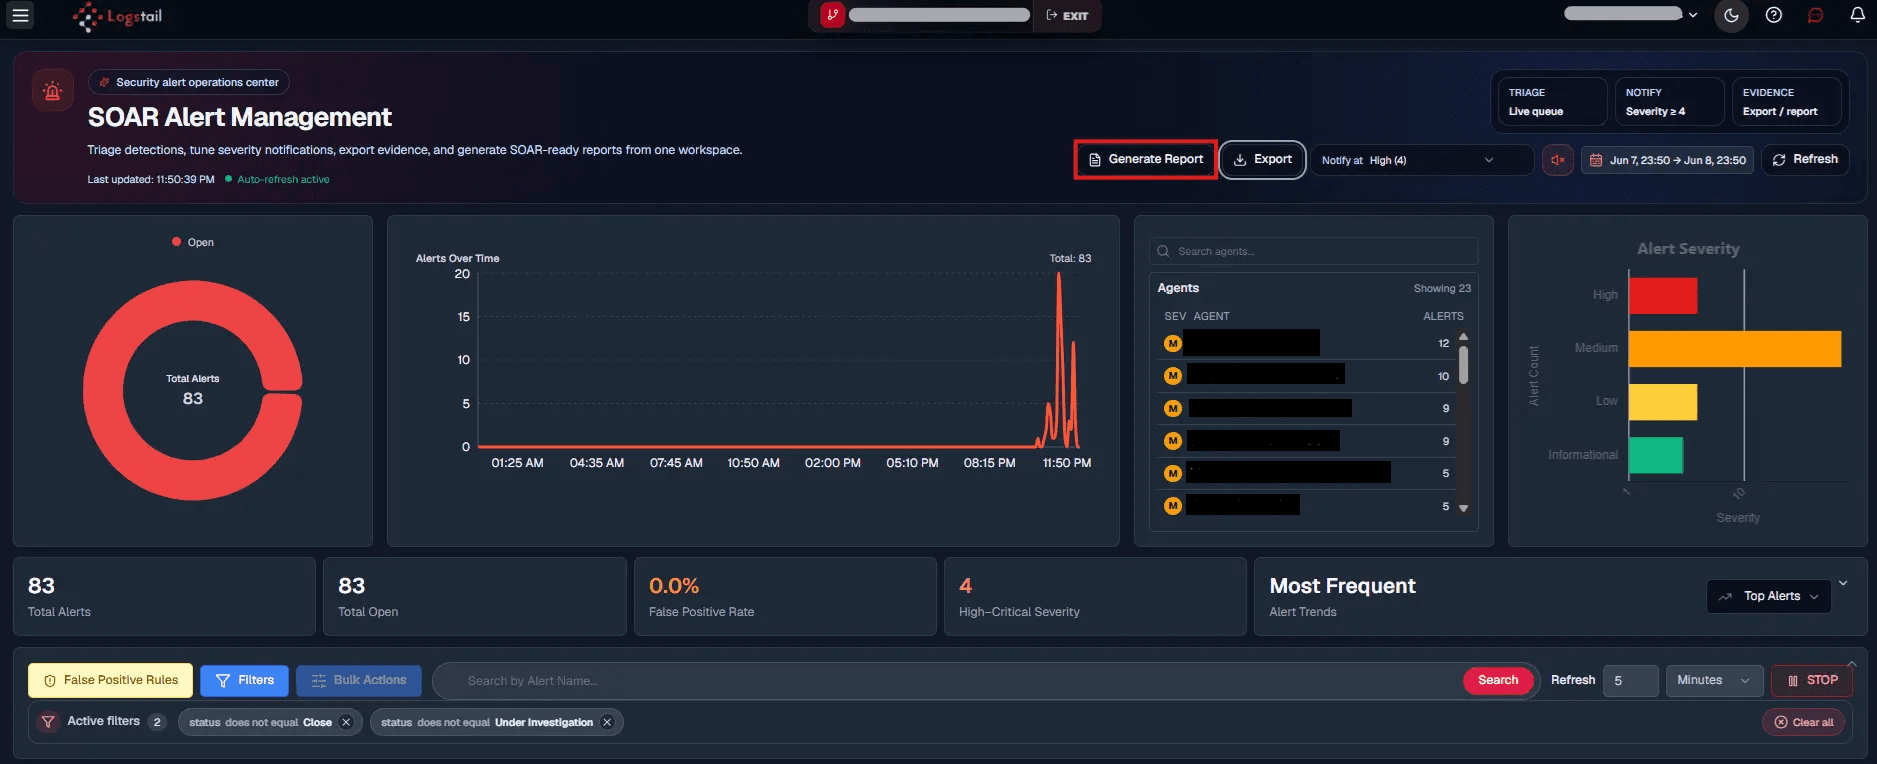
Before generating a report, set the correct timeframe, search terms, and filters. The report reflects the current page context, so it should be scoped intentionally.
Use generated reports for:
Export Alerts
Use Export to download alert data in a structured format such as CSV or XLSX.
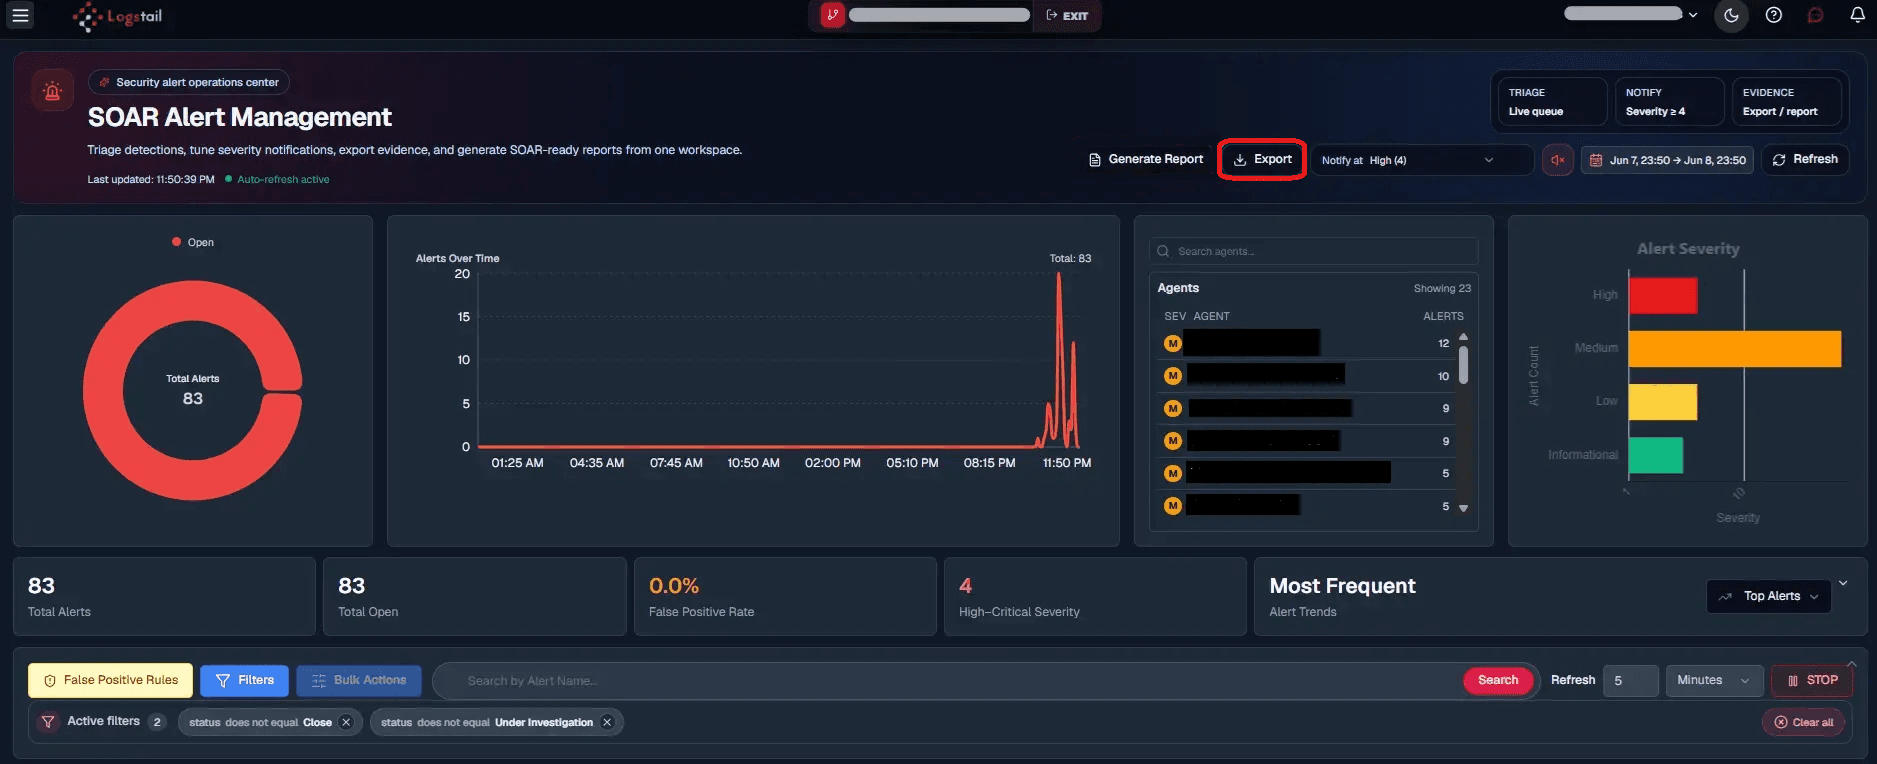
Exports are useful for:
Exported alert attributes may include fields such as agent name, agent group, alert name, severity, MITRE tactic, timestamp, status, flag, and assignee.
Use Live Refresh
Live refresh keeps the alert table updated with incoming alerts.
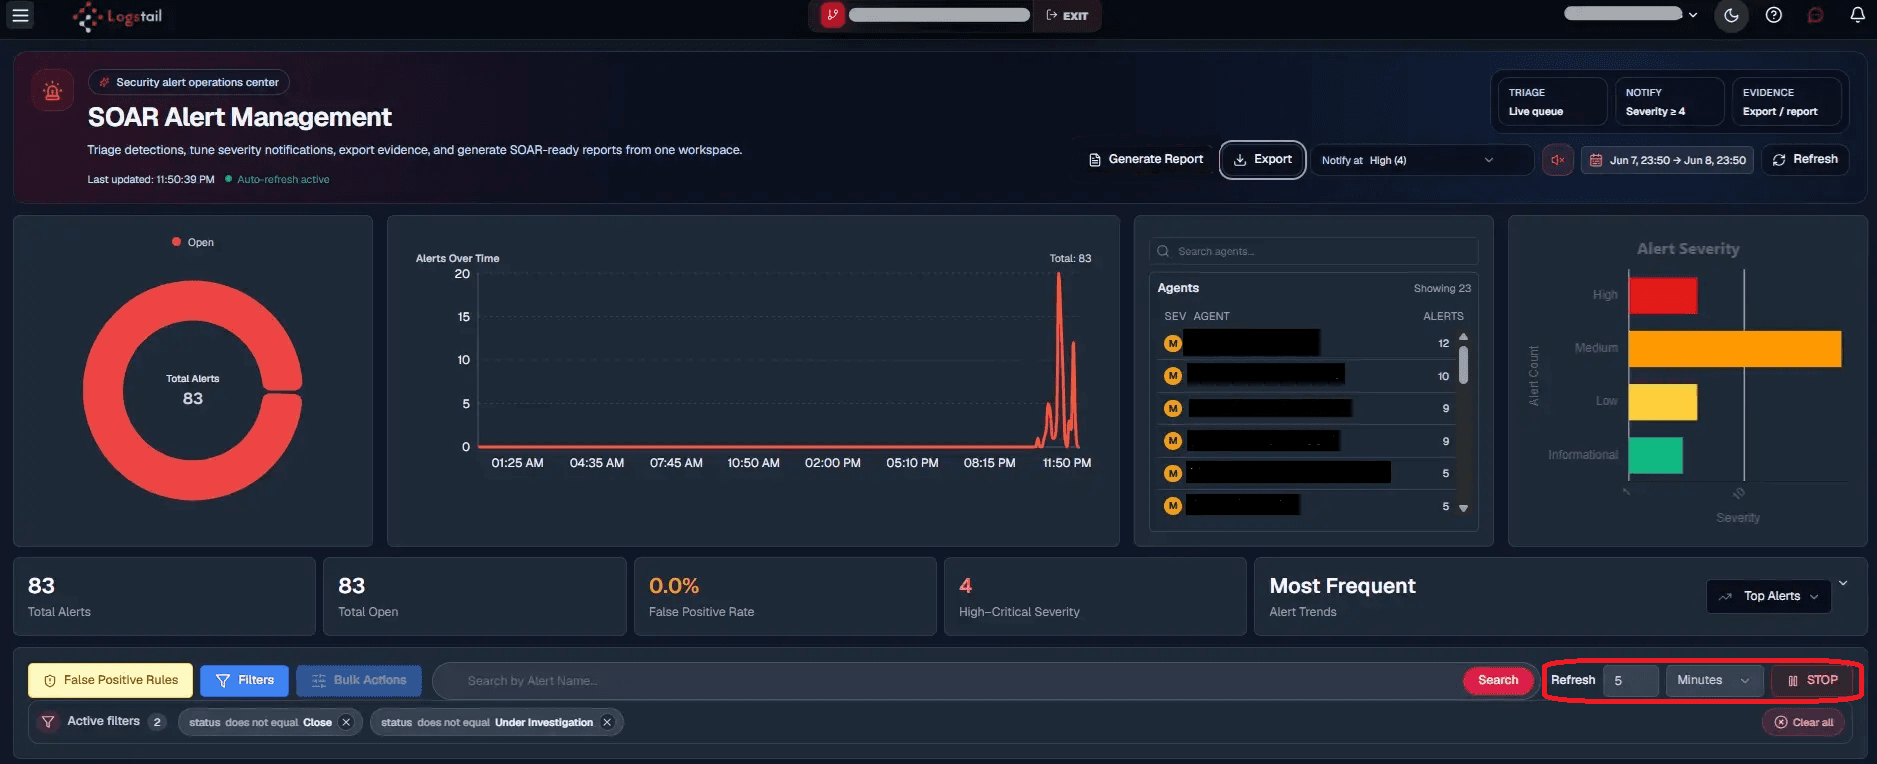
Users can configure refresh frequency in minutes or seconds and start or stop automatic refresh. While live refresh is active, the interface indicates that updates are running.
Use live refresh for:
Stop live refresh when performing careful manual triage to avoid losing context as the table updates.
Pagination
Pagination controls how many alerts appear per page and how users move through the alert queue.
Pagination controls typically include:
Pagination Controls
| Control | Purpose | |
|---|---|---|
| Page size | Changes how many alerts are displayed per page. | |
| Previous/next arrows | Moves between pages. | |
| Go to page | Jumps directly to a specified page. |
Use pagination when reviewing large alert volumes or when filtering still returns many results.
Recommended Triage Workflow
Use this workflow for clean and consistent alert handling:
Troubleshooting
The alert table is empty
- 1
Validate the selected timeframe.
- 2
Clear filters or search terms.
- 3
Refresh the page.
- 4
Confirm that agents are generating logs and monitors are active.
Expected alerts are missing
- 1
Alert may be outside the timeframe.
- 2
A false-positive ruleset may have closed it.
- 3
Filters may be hiding it.
- 4
Page may need a refresh
Too many alerts are visible
- 1
Use severity, status, assignee, or MITRE filters to reduce alert quantity and specialize the results.
- 2
Consider false-positive rulesets for repeated benign alerts.
Saved filter does not show expected alerts
- 1
Check timeframe alignment.
- 2
Ensure fields used in the filter still exist.
Live refresh is distracting
- 1
Disable auto-refresh during triage.
- 2
Increase the refresh interval
- 3
Re-enable after completing actions.
A false-positive rule is too broad
- 1
Disable or delete the ruleset.
- 2
Recreate it with more specific field-value pairs.
Best Practices
Start with critical and high-severity alerts
Prioritize the most impactful alerts first. Critical and high alerts ought to take precedent. This will ensure the best security.
Use saved filters for repeatable workflows
Standardize SOC triage views.
Assign alerts early
Ensure ownership is clear from the start. Analysts should be accountable and be assigned early for immediate alert response.
Avoid closing alerts prematurely
Review details before resolving an alert. A malicious incident being closed prematurely proves to be a massive security liability.
Use Under Investigation appropriately
Mark alerts that require ongoing analysis.
Use Verified only for confirmed threats
Reserve verification for real suspicious or malicious activity. This way alerts of interest can be recalled effectively and isolated from the noise.
Use false-positive rulesets carefully
Apply only with precise field-value criteria. It should be certain that these rulesets don't hide any incident from analyis.
Attach related alerts to existing cases
Avoid creating duplicate cases.
Generate reports after setting filters
Ensure the timeframe and filters match the investigation the report regards.
Review frequent alerts for tuning
Identify noisy and rare suspicious behavior. The platform should be communicating the important alerts effectively against the noisy begnign triggers.
Related Pages
Related Pages
| Page | Description |
|---|---|
| Integrations | Configure and manage connections between Logstail's SOAR and external security tools and services. |
| Playbooks | Build, import, manage, and operate automated response workflows. |
| Integration Runners | Register, deploy, group, and monitor runtime workers. |
| Cases | Manage incident investigations and response activities. |
| Monitors | Create and manage alerting rules that evaluate security and operational data. |
| Notification Channels | Configure how alerts are delivered to users, teams, and external systems. |
| Contacts | Manage people and teams involved in security operations and incident response. |